Banking for 7 billion and 7 million
New challenges and opportunities of globalization Global Investor, 03/2006 Credit Suisse
New challenges and opportunities of globalization
Global Investor, 03/2006
Credit Suisse

Create successful ePaper yourself
Turn your PDF publications into a flip-book with our unique Google optimized e-Paper software.
GLOBAL INVESTOR 3.06 Switching — 61<br />
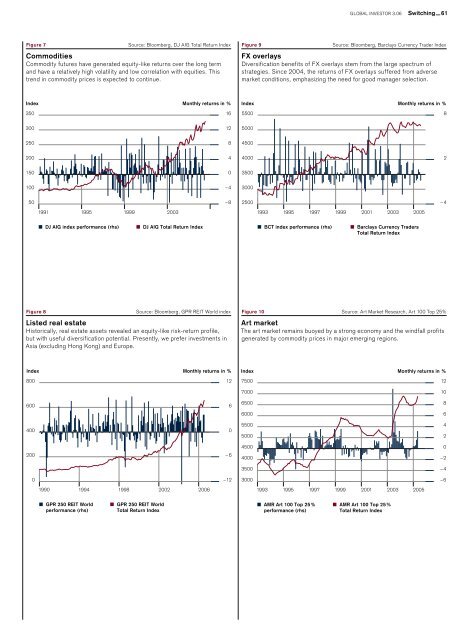
Figure 7<br />
Source: Bloomberg, DJ AIG Total Return Index<br />
Commodities<br />
Commodity futures have generated equity-like returns over the long term<br />
<strong>and</strong> have a relatively high volatility <strong>and</strong> low correlation with equities. This<br />
trend in commodity prices is expected to continue.<br />
Figure 9<br />
Source: Bloomberg, Barclays Currency Trader Index<br />
FX overlays<br />
Diversification benefits of FX overlays stem from the large spectrum of<br />
strategies. Since 2004, the returns of FX overlays suffered from adverse<br />
market conditions, emphasizing the need <strong>for</strong> good manager selection.<br />
Index Monthly returns in %<br />
350<br />
16<br />
Index Monthly returns in %<br />
5500<br />
8<br />
300<br />
12<br />
5000<br />
250<br />
8<br />
4500<br />
200<br />
4<br />
4000<br />
2<br />
150<br />
0<br />
3500<br />
100<br />
–4<br />
3000<br />
50<br />
–8<br />
2500<br />
– 4<br />
1991 1995 1999<br />
2003<br />
1993 1995 1997 1999 2001 2003 2005<br />
DJ AIG index per<strong>for</strong>mance (rhs)<br />
DJ AIG Total Return Index<br />
BCT index per<strong>for</strong>mance (rhs)<br />
Barclays Currency Traders<br />
Total Return Index<br />
Figure 8<br />
Source: Bloomberg, GPR REIT World index<br />
Listed real estate<br />
Historically, real estate assets revealed an equity-like risk-return profile,<br />
but with useful diversification potential. Presently, we prefer investments in<br />
Asia (excluding Hong Kong) <strong>and</strong> Europe.<br />
Figure 10 Source: Art Market Research, Art 100 Top 25%<br />
Art market<br />
The art market remains buoyed by a strong economy <strong>and</strong> the windfall profits<br />
generated by commodity prices in major emerging regions.<br />
Index Monthly returns in %<br />
800<br />
12<br />
Index Monthly returns in %<br />
7500<br />
12<br />
7000<br />
10<br />
600<br />
6<br />
6500<br />
6000<br />
8<br />
6<br />
400<br />
0<br />
5500<br />
5000<br />
4<br />
2<br />
200<br />
– 6<br />
4500<br />
4000<br />
0<br />
–2<br />
3500<br />
–4<br />
0<br />
–12<br />
3000<br />
–6<br />
1990 1994 1998<br />
2002 2006<br />
1993 1995 1997 1999 2001 2003 2005<br />
GPR 250 REIT World<br />
per<strong>for</strong>mance (rhs)<br />
GPR 250 REIT World<br />
Total Return Index<br />
AMR Art 100 Top 25%<br />
per<strong>for</strong>mance (rhs)<br />
AMR Art 100 Top 25%<br />
Total Return Index