Government Pension Fund Global Holding of equities at 31 ... - NBIM
Government Pension Fund Global Holding of equities at 31 ... - NBIM
Government Pension Fund Global Holding of equities at 31 ... - NBIM

You also want an ePaper? Increase the reach of your titles
YUMPU automatically turns print PDFs into web optimized ePapers that Google loves.
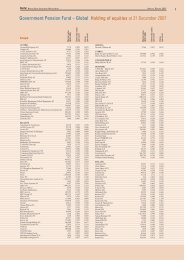
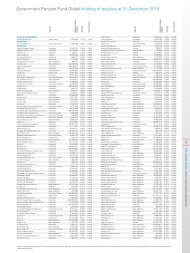
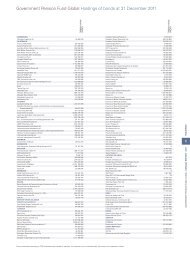
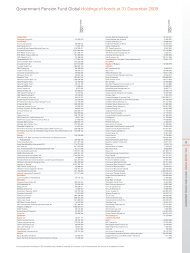
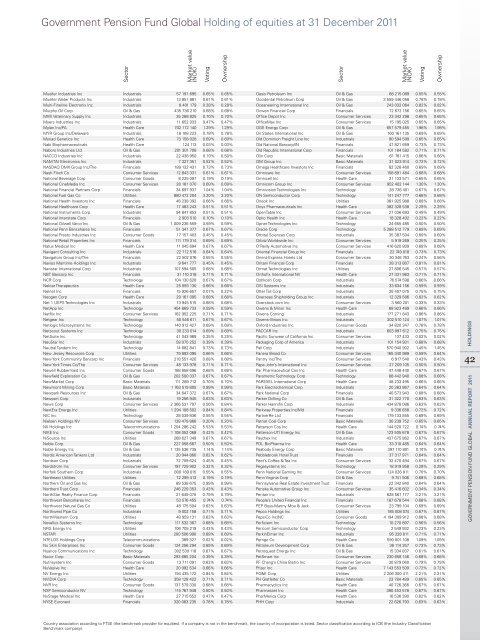
<strong>Government</strong> <strong>Pension</strong> <strong>Fund</strong> <strong>Global</strong> <strong>Holding</strong> <strong>of</strong> <strong>equities</strong> <strong>at</strong> <strong>31</strong> December 2011<br />
sector<br />
market value<br />
(noK)<br />
mueller industries inc industrials 57 191 695 0.65% 0.65%<br />
mueller W<strong>at</strong>er Products inc industrials 13 851 881 0.61% 0.61%<br />
multi-Fineline electronix inc industrials 8 401 179 0.28% 0.28%<br />
murphy oil Corp oil & Gas 435 736 210 0.68% 0.68%<br />
mWi veterinary supply inc industrials 35 268 825 0.70% 0.70%<br />
myers industries inc industrials 11 652 033 0.47% 0.47%<br />
mylan inc/Pa Health Care 702 172 140 1.29% 1.29%<br />
mYr Group inc/Delaware industrials 18 108 223 0.78% 0.78%<br />
myriad Genetics inc Health Care 73 158 028 0.69% 0.69%<br />
nabi biopharmaceuticals Health Care 124 113 0.03% 0.03%<br />
nabors industries ltd oil & Gas 201 301 708 0.68% 0.68%<br />
naCCo industries inc industrials 22 438 950 0.19% 0.50%<br />
nam tai electronics inc industrials 7 327 351 0.52% 0.52%<br />
nasDaQ omX Group inc/the Financials 189 132 4<strong>31</strong> 0.73% 0.73%<br />
nash Finch Co Consumer services 12 843 3<strong>31</strong> 0.61% 0.61%<br />
n<strong>at</strong>ional beverage Corp Consumer Goods 8 225 097 0.19% 0.19%<br />
n<strong>at</strong>ional Cinemedia inc Consumer services 28 181 070 0.69% 0.69%<br />
n<strong>at</strong>ional Financial Partners Corp Financials 34 697 937 1.04% 1.04%<br />
n<strong>at</strong>ional Fuel Gas Co utilities 880 472 204 3.20% 3.20%<br />
n<strong>at</strong>ional Health investors inc Financials 48 238 392 0.66% 0.66%<br />
n<strong>at</strong>ional Healthcare Corp Health Care 17 483 243 0.51% 0.51%<br />
n<strong>at</strong>ional instruments Corp industrials 94 847 853 0.51% 0.51%<br />
n<strong>at</strong>ional interst<strong>at</strong>e Corp Financials 2 903 510 0.10% 0.10%<br />
n<strong>at</strong>ional oilwell varco inc oil & Gas 1 009 236 559 0.59% 0.59%<br />
n<strong>at</strong>ional Penn bancshares inc Financials 51 341 377 0.67% 0.67%<br />
n<strong>at</strong>ional Presto industries inc Consumer Goods 17 157 403 0.45% 0.45%<br />
n<strong>at</strong>ional retail Properties inc Financials 111 179 <strong>31</strong>4 0.69% 0.69%<br />
n<strong>at</strong>us medical inc Health Care 11 045 694 0.67% 0.67%<br />
navigant Consulting inc industrials 22 712 516 0.64% 0.64%<br />
navig<strong>at</strong>ors Group inc/the Financials 22 502 076 0.55% 0.55%<br />
navios maritime <strong>Holding</strong>s inc industrials 9 641 777 0.45% 0.45%<br />
navistar intern<strong>at</strong>ional Corp industrials 107 594 505 0.68% 0.68%<br />
nbt bancorp inc Financials <strong>31</strong> 110 <strong>31</strong>8 0.71% 0.71%<br />
nCr Corp technology 104 130 628 0.67% 0.67%<br />
nektar therapeutics Health Care 25 093 130 0.66% 0.66%<br />
nelnet inc Financials 15 926 657 0.07% 0.22%<br />
neogen Corp Health Care 29 161 095 0.68% 0.68%<br />
net 1 uePs technologies inc industrials 13 945 515 0.68% 0.68%<br />
netapp inc technology 454 869 733 0.59% 0.59%<br />
netflix inc Consumer services 162 952 225 0.71% 0.71%<br />
netgear inc technology 50 546 611 0.67% 0.67%<br />
netlogic microsystems inc technology 140 912 427 0.69% 0.69%<br />
netscout systems inc technology 30 233 014 0.69% 0.69%<br />
netsuite inc technology 41 043 989 0.25% 0.25%<br />
neustar inc industrials 58 070 252 0.39% 0.39%<br />
neutral tandem inc technology 14 682 841 0.73% 0.73%<br />
new Jersey resources Corp utilities 79 893 095 0.66% 0.66%<br />
new York Community bancorp inc Financials 218 551 420 0.68% 0.68%<br />
new York times Co/the Consumer services 48 133 978 0.71% 0.71%<br />
newell rubbermaid inc Consumer Goods 188 858 696 0.68% 0.68%<br />
newfield explor<strong>at</strong>ion Co oil & Gas 202 500 337 0.67% 0.67%<br />
newmarket Corp basic m<strong>at</strong>erials 111 289 712 0.70% 0.70%<br />
newmont mining Corp basic m<strong>at</strong>erials 1 763 519 805 0.99% 0.99%<br />
newpark resources inc oil & Gas 34 647 372 0.67% 0.67%<br />
newport Corp industrials 19 256 945 0.63% 0.63%<br />
news Corp Consumer services 2 366 5<strong>31</strong> 797 0.50% 0.84%<br />
nextera energy inc utilities 1 294 108 502 0.84% 0.84%<br />
niC inc technology 28 039 836 0.55% 0.55%<br />
nielsen <strong>Holding</strong>s nv Consumer services 128 479 866 0.20% 0.20%<br />
nii <strong>Holding</strong>s inc telecommunic<strong>at</strong>ions 1 204 286 242 5.53% 5.53%<br />
niKe inc Consumer Goods 1 108 052 068 0.42% 0.42%<br />
nisource inc utilities 268 627 349 0.67% 0.67%<br />
noble Corp oil & Gas 227 058 687 0.50% 0.50%<br />
noble energy inc oil & Gas 1 135 536 735 1.14% 1.14%<br />
nordic american tankers ltd industrials 20 944 860 0.62% 0.62%<br />
nordson Corp industrials 72 709 624 0.45% 0.45%<br />
nordstrom inc Consumer services 197 729 902 0.32% 0.32%<br />
norfolk southern Corp industrials 800 189 015 0.55% 0.55%<br />
northeast utilities utilities 72 299 413 0.19% 0.19%<br />
northern oil and Gas inc oil & Gas 89 538 675 0.99% 0.99%<br />
northern trust Corp Financials 246 229 353 0.43% 0.43%<br />
northstar realty Finance Corp Financials 21 649 075 0.79% 0.79%<br />
northwest bancshares inc Financials 53 576 455 0.74% 0.74%<br />
northwest n<strong>at</strong>ural Gas Co utilities 48 175 504 0.63% 0.63%<br />
northwest Pipe Co industrials 9 002 158 0.71% 0.71%<br />
northWestern Corp utilities 48 959 1<strong>31</strong> 0.63% 0.63%<br />
novellus systems inc technology 111 532 367 0.68% 0.68%<br />
nrG energy inc utilities 106 705 219 0.43% 0.43%<br />
nstar utilities 200 506 990 0.69% 0.69%<br />
ntelos <strong>Holding</strong>s Corp telecommunic<strong>at</strong>ions 389 327 0.02% 0.02%<br />
nu skin enterprises inc Consumer Goods 124 256 294 0.69% 0.69%<br />
nuance Communic<strong>at</strong>ions inc technology 302 530 118 0.67% 0.67%<br />
nucor Corp basic m<strong>at</strong>erials 293 685 204 0.39% 0.39%<br />
nutrisystem inc Consumer Goods 13 711 091 0.63% 0.63%<br />
nuvasive inc Health Care 20 992 534 0.66% 0.66%<br />
nv energy inc utilities 194 435 172 0.84% 0.84%<br />
nviDia Corp technology 358 128 422 0.71% 0.71%<br />
nvr inc Consumer Goods 137 579 330 0.68% 0.68%<br />
nXP semiconductor nv technology 115 767 948 0.50% 0.50%<br />
nxstage medical inc Health Care 27 715 653 0.47% 0.47%<br />
nYse euronext Financials 320 083 235 0.78% 0.78%<br />
voting<br />
ownership<br />
sector<br />
market value<br />
(noK)<br />
oasis Petroleum inc oil & Gas 88 215 089 0.55% 0.55%<br />
occidental Petroleum Corp oil & Gas 3 559 446 058 0.78% 0.78%<br />
oceaneering intern<strong>at</strong>ional inc oil & Gas 243 032 064 0.82% 0.82%<br />
ocwen Financial Corp Financials 72 672 156 0.65% 0.65%<br />
<strong>of</strong>fice Depot inc Consumer services 23 342 298 0.65% 0.65%<br />
<strong>of</strong>ficemax inc Consumer services 15 195 025 0.65% 0.65%<br />
oGe energy Corp oil & Gas 657 579 455 1.98% 1.98%<br />
oil st<strong>at</strong>es intern<strong>at</strong>ional inc oil & Gas 160 161 135 0.69% 0.69%<br />
old Dominion Freight line inc industrials 90 594 599 0.65% 0.65%<br />
old n<strong>at</strong>ional bancorp/in Financials 47 821 659 0.73% 0.73%<br />
old republic intern<strong>at</strong>ional Corp Financials 101 184 582 0.71% 0.71%<br />
olin Corp basic m<strong>at</strong>erials 61 761 415 0.66% 0.66%<br />
om Group inc basic m<strong>at</strong>erials <strong>31</strong> 023 914 0.72% 0.72%<br />
omega Healthcare investors inc Financials 82 328 460 0.69% 0.69%<br />
omnicare inc Consumer services 158 891 484 0.68% 0.68%<br />
omnicell inc Health Care 21 133 571 0.65% 0.65%<br />
omnicom Group inc Consumer services 952 402 144 1.30% 1.30%<br />
omnivision technologies inc technology 28 736 401 0.67% 0.67%<br />
on semiconductor Corp technology 141 247 777 0.68% 0.68%<br />
oneok inc utilities 361 925 988 0.68% 0.68%<br />
onyx Pharmaceuticals inc Health Care 382 328 538 2.29% 2.29%<br />
opentable inc Consumer services 27 036 693 0.49% 0.49%<br />
opko Health inc Health Care 18 328 402 0.22% 0.22%<br />
opnet technologies inc technology 24 655 485 0.50% 0.50%<br />
oracle Corp technology 5 288 512 779 0.69% 0.69%<br />
orbital sciences Corp industrials 35 387 504 0.69% 0.69%<br />
orbitz Worldwide inc Consumer services 5 919 269 0.25% 0.25%<br />
o’reilly automotive inc Consumer services 416 620 809 0.68% 0.68%<br />
oriental Financial Group inc Financials 22 749 018 0.73% 0.73%<br />
orient-express Hotels ltd Consumer services 30 346 763 0.24% 0.56%<br />
oritani Financial Corp Financials 28 <strong>31</strong>3 807 0.81% 0.81%<br />
orm<strong>at</strong> technologies inc utilities 27 806 545 0.57% 0.57%<br />
orth<strong>of</strong>ix intern<strong>at</strong>ional nv Health Care 27 3<strong>31</strong> 983 0.71% 0.71%<br />
oshkosh Corp industrials 76 574 598 0.66% 0.66%<br />
osi systems inc industrials 33 634 156 0.59% 0.59%<br />
otter tail Corp industrials 35 407 075 0.75% 0.75%<br />
overseas shipholding Group inc industrials 12 329 586 0.62% 0.62%<br />
overstock.com inc Consumer services 3 560 201 0.33% 0.33%<br />
owens & minor inc Health Care 68 923 499 0.66% 0.66%<br />
owens Corning industrials 177 271 843 0.86% 0.86%<br />
owens-illinois inc industrials 202 510 124 1.07% 1.07%<br />
oxford industries inc Consumer Goods 34 820 347 0.78% 0.78%<br />
PaCCar inc industrials 603 997 612 0.75% 0.75%<br />
Pacific sunwear <strong>of</strong> California inc Consumer services 137 433 0.02% 0.02%<br />
Packaging Corp <strong>of</strong> america industrials 101 154 9<strong>31</strong> 0.68% 0.68%<br />
Pall Corp industrials 570 940 902 1.45% 1.45%<br />
Panera bread Co Consumer services 165 340 989 0.59% 0.64%<br />
Pantry inc/the Consumer services 6 917 540 0.43% 0.43%<br />
Papa John’s intern<strong>at</strong>ional inc Consumer services 27 209 105 0.50% 0.50%<br />
Par Pharmaceutical Cos inc Health Care 47 448 440 0.67% 0.67%<br />
Parametric technology Corp technology 88 442 940 0.68% 0.68%<br />
PareXel intern<strong>at</strong>ional Corp Health Care 48 233 495 0.66% 0.66%<br />
Park electrochemical Corp industrials 20 383 867 0.64% 0.64%<br />
Park n<strong>at</strong>ional Corp Financials 40 573 943 0.68% 0.68%<br />
Parker Drilling Co oil & Gas <strong>31</strong> 322 770 0.63% 0.63%<br />
Parker Hannifin Corp industrials 434 878 086 0.63% 0.63%<br />
Parkway Properties inc/md Financials 9 336 658 0.72% 0.72%<br />
Partnerre ltd Financials 179 133 555 0.69% 0.69%<br />
P<strong>at</strong>riot Coal Corp basic m<strong>at</strong>erials 30 239 752 0.65% 0.65%<br />
P<strong>at</strong>terson Cos inc Health Care 144 520 722 0.74% 0.74%<br />
P<strong>at</strong>terson-uti energy inc oil & Gas 123 505 678 0.67% 0.67%<br />
Paychex inc industrials 437 675 862 0.67% 0.67%<br />
PDl bioPharma inc Health Care 33 <strong>31</strong>0 485 0.64% 0.64%<br />
Peabody energy Corp basic m<strong>at</strong>erials 397 110 801 0.74% 0.74%<br />
Pebblebrook Hotel trust Financials 37 <strong>31</strong>7 971 0.64% 0.64%<br />
Peet’s C<strong>of</strong>fee & tea inc Consumer services 32 470 494 0.67% 0.67%<br />
Pegasystems inc technology 18 919 958 0.29% 0.29%<br />
Penn n<strong>at</strong>ional Gaming inc Consumer services 124 026 811 0.70% 0.70%<br />
Penn virginia Corp oil & Gas 9 741 506 0.68% 0.68%<br />
Pennsylvania real est<strong>at</strong>e investment trust Financials 22 342 840 0.64% 0.64%<br />
Penske automotive Group inc Consumer services 35 416 602 0.34% 0.34%<br />
Pentair inc industrials 628 567 177 3.21% 3.21%<br />
People’s united Financial inc Financials 187 678 544 0.68% 0.68%<br />
PeP boys-manny moe & Jack Consumer services 23 799 104 0.69% 0.69%<br />
Pepco <strong>Holding</strong>s inc utilities 185 008 074 0.67% 0.67%<br />
PepsiCo inc/nC Consumer Goods 4 194 309 912 0.68% 0.68%<br />
Perficient inc technology 10 270 897 0.56% 0.56%<br />
Pericom semiconductor Corp technology 2 549 932 0.23% 0.23%<br />
Perkinelmer inc industrials 95 328 811 0.71% 0.71%<br />
Perrigo Co Health Care 590 001 108 1.09% 1.09%<br />
Petroleum Development Corp oil & Gas 36 114 357 0.73% 0.73%<br />
Petroquest energy inc oil & Gas 15 334 837 0.61% 0.61%<br />
Petsmart inc Consumer services 230 658 146 0.68% 0.68%<br />
PF Chang’s China bistro inc Consumer services 30 879 060 0.79% 0.79%<br />
Pfizer inc Health Care 7 143 553 509 0.72% 0.72%<br />
PG&e Corp utilities 2 206 300 411 2.21% 2.21%<br />
PH Gl<strong>at</strong>felter Co basic m<strong>at</strong>erials 23 784 489 0.65% 0.65%<br />
Pharmacyclics inc Health Care 40 726 366 0.67% 0.67%<br />
Pharmasset inc Health Care 390 453 578 0.67% 0.67%<br />
Pharmerica Corp Health Care 16 536 390 0.62% 0.62%<br />
PHH Corp industrials 22 626 793 0.63% 0.63%<br />
Country associ<strong>at</strong>ion according to Ftse (the benchmark provider for <strong>equities</strong>). if a company is not in the benchmark, the country <strong>of</strong> incorpor<strong>at</strong>ion is listed. sector classific<strong>at</strong>ion according to iCb (the industry Classific<strong>at</strong>ion<br />
benchmark company).<br />
voting<br />
ownership<br />
HOLdiNgs<br />
42<br />
<strong>Government</strong> <strong>Pension</strong> FunD <strong>Global</strong> ANNUAL REPORT 2011