Government Pension Fund Global Holding of equities at 31 ... - NBIM
Government Pension Fund Global Holding of equities at 31 ... - NBIM
Government Pension Fund Global Holding of equities at 31 ... - NBIM

You also want an ePaper? Increase the reach of your titles
YUMPU automatically turns print PDFs into web optimized ePapers that Google loves.
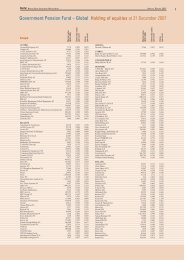
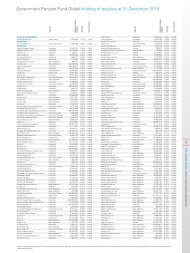
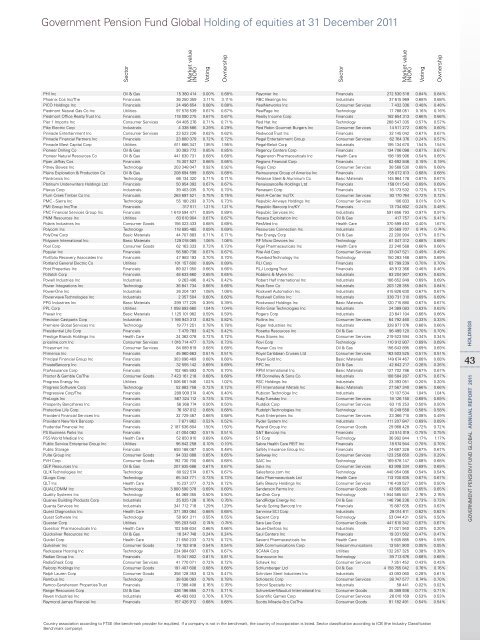
<strong>Government</strong> <strong>Pension</strong> <strong>Fund</strong> <strong>Global</strong> <strong>Holding</strong> <strong>of</strong> <strong>equities</strong> <strong>at</strong> <strong>31</strong> December 2011<br />
sector<br />
market value<br />
(noK)<br />
PHi inc oil & Gas 15 380 414 0.00% 0.68%<br />
Phoenix Cos inc/the Financials 36 250 359 3.11% 3.11%<br />
PiCo <strong>Holding</strong>s inc Financials 24 496 654 0.88% 0.88%<br />
Piedmont n<strong>at</strong>ural Gas Co inc utilities 97 578 539 0.67% 0.67%<br />
Piedmont <strong>of</strong>fice realty trust inc Financials 118 090 275 0.67% 0.67%<br />
Pier 1 imports inc Consumer services 64 485 276 0.71% 0.71%<br />
Pike electric Corp industrials 4 338 586 0.29% 0.29%<br />
Pinnacle entertainment inc Consumer services 23 523 226 0.62% 0.62%<br />
Pinnacle Financial Partners inc Financials 23 800 379 0.72% 0.72%<br />
Pinnacle West Capital Corp utilities 611 666 347 1.95% 1.95%<br />
Pioneer Drilling Co oil & Gas 30 383 772 0.85% 0.85%<br />
Pioneer n<strong>at</strong>ural resources Co oil & Gas 441 630 7<strong>31</strong> 0.68% 0.68%<br />
Piper Jaffray Cos Financials 15 307 527 0.66% 0.66%<br />
Pitney bowes inc technology 203 348 047 0.92% 0.92%<br />
Plains explor<strong>at</strong>ion & Production Co oil & Gas 208 694 599 0.68% 0.68%<br />
Plantronics inc technology 66 134 320 0.71% 0.71%<br />
Pl<strong>at</strong>inum underwriters <strong>Holding</strong>s ltd Financials 50 954 392 0.67% 0.67%<br />
Plexus Corp industrials 39 403 035 0.70% 0.70%<br />
Plum Creek timber Co inc Financials 263 697 521 0.75% 0.75%<br />
PmC - sierra inc technology 55 180 293 0.73% 0.73%<br />
Pmi Group inc/the Financials <strong>31</strong>7 511 1.21% 1.21%<br />
PnC Financial services Group inc Financials 1 619 594 471 0.89% 0.89%<br />
Pnm resources inc utilities 63 610 904 0.67% 0.67%<br />
Polaris industries inc Consumer Goods 156 023 433 0.68% 0.68%<br />
Polycom inc technology 118 895 485 0.69% 0.69%<br />
Polyone Corp basic m<strong>at</strong>erials 44 707 883 0.71% 0.71%<br />
Polypore intern<strong>at</strong>ional inc basic m<strong>at</strong>erials 129 018 065 1.06% 1.06%<br />
Pool Corp Consumer Goods 62 163 333 0.73% 0.73%<br />
Popular inc Financials 56 580 738 0.67% 0.67%<br />
Portfolio recovery associ<strong>at</strong>es inc Financials 47 983 193 0.70% 0.70%<br />
Portland General electric Co utilities 101 157 600 0.89% 0.89%<br />
Post Properties inc Financials 89 021 050 0.66% 0.66%<br />
Potl<strong>at</strong>ch Corp Financials 48 633 660 0.65% 0.65%<br />
Powell industries inc industrials 9 263 496 0.42% 0.42%<br />
Power integr<strong>at</strong>ions inc technology 36 841 734 0.66% 0.66%<br />
Power-one inc industrials 26 204 197 1.08% 1.08%<br />
Powerwave technologies inc industrials 2 357 504 0.60% 0.60%<br />
PPG industries inc basic m<strong>at</strong>erials 299 177 225 0.39% 0.39%<br />
PPl Corp utilities 1 058 893 660 1.04% 1.04%<br />
Praxair inc basic m<strong>at</strong>erials 1 125 101 982 0.59% 0.59%<br />
Precision Castparts Corp industrials 1 166 943 <strong>31</strong>3 0.82% 0.82%<br />
Premiere <strong>Global</strong> services inc technology 19 771 251 0.78% 0.78%<br />
Presidential life Corp Financials 7 479 783 0.42% 0.42%<br />
Prestige brands <strong>Holding</strong>s inc Health Care 24 362 078 0.72% 0.72%<br />
priceline.com inc Consumer services 1 016 714 477 0.73% 0.73%<br />
Pricesmart inc Consumer services 84 089 819 0.68% 0.68%<br />
Primerica inc Financials 45 960 663 0.51% 0.51%<br />
Principal Financial Group inc Financials 303 696 469 0.68% 0.68%<br />
Priv<strong>at</strong>ebancorp inc Financials 32 555 142 0.69% 0.69%<br />
Proassurance Corp Financials 102 465 893 0.70% 0.70%<br />
Procter & Gamble Co/the Consumer Goods 7 423 161 218 0.68% 0.68%<br />
Progress energy inc utilities 1 006 661 946 1.02% 1.02%<br />
Progress s<strong>of</strong>tware Corp technology 52 883 758 0.72% 0.72%<br />
Progressive Corp/the Financials 289 909 374 0.40% 0.40%<br />
Prologis inc Financials 567 324 112 0.73% 0.73%<br />
Prosperity bancshares inc Financials 56 368 774 0.50% 0.50%<br />
Protective life Corp Financials 76 187 012 0.68% 0.68%<br />
Provident Financial services inc Financials 32 729 487 0.68% 0.68%<br />
Provident new York bancorp Financials 7 871 862 0.52% 0.52%<br />
Prudential Financial inc Financials 2 187 636 804 1.50% 1.50%<br />
Ps business Parks inc Financials 41 004 082 0.51% 0.51%<br />
Pss World medical inc Health Care 52 850 910 0.69% 0.69%<br />
Public service enterprise Group inc utilities 96 842 258 0.10% 0.10%<br />
Public storage Financials 693 188 087 0.50% 0.48%<br />
Pulte Group inc Consumer Goods 94 332 888 0.65% 0.65%<br />
PvH Corp Consumer Goods 192 730 700 0.68% 0.68%<br />
QeP resources inc oil & Gas 207 835 686 0.67% 0.67%<br />
QliK technologies inc technology 80 922 574 0.67% 0.67%<br />
Qlogic Corp technology 65 343 771 0.73% 0.73%<br />
Qlt inc Health Care 15 237 377 0.72% 0.72%<br />
QualComm inc technology 3 800 590 378 0.69% 0.69%<br />
Quality systems inc technology 64 369 355 0.50% 0.50%<br />
Quanex building Products Corp industrials 25 025 128 0.76% 0.76%<br />
Quanta services inc industrials 341 712 718 1.29% 1.29%<br />
Quest Diagnostics inc Health Care 371 393 064 0.68% 0.68%<br />
Quest s<strong>of</strong>tware inc technology 50 961 211 0.55% 0.55%<br />
Questar Corp utilities 155 203 543 0.74% 0.74%<br />
Questcor Pharmaceuticals inc Health Care 102 548 634 0.66% 0.66%<br />
Quicksilver resources inc oil & Gas 16 347 748 0.24% 0.24%<br />
Quidel Corp Health Care 21 650 233 0.72% 0.72%<br />
Quiksilver inc Consumer Goods 19 152 818 0.54% 0.54%<br />
rackspace Hosting inc technology 224 984 697 0.67% 0.67%<br />
radian Group inc Financials 15 041 802 0.81% 0.81%<br />
radioshack Corp Consumer services 41 770 071 0.72% 0.72%<br />
ralcorp <strong>Holding</strong>s inc Consumer Goods 191 407 608 0.68% 0.68%<br />
ralph lauren Corp Consumer Goods 356 128 353 0.12% 0.47%<br />
rambus inc technology 38 636 083 0.78% 0.78%<br />
ramco-Gershenson Properties trust Financials 17 388 408 0.76% 0.76%<br />
range resources Corp oil & Gas 426 196 855 0.71% 0.71%<br />
raven industries inc industrials 46 493 603 0.70% 0.70%<br />
raymond James Financial inc Financials 157 426 912 0.68% 0.68%<br />
voting<br />
ownership<br />
sector<br />
market value<br />
(noK)<br />
rayonier inc Financials 272 530 518 0.84% 0.84%<br />
rbC bearings inc industrials 37 615 969 0.68% 0.68%<br />
realnetworks inc Consumer services 7 432 336 0.48% 0.48%<br />
realPage inc technology 17 788 051 0.16% 0.16%<br />
realty income Corp Financials 182 654 <strong>31</strong>3 0.66% 0.66%<br />
red H<strong>at</strong> inc technology 268 547 335 0.57% 0.57%<br />
red robin Gourmet burgers inc Consumer services 14 511 272 0.60% 0.60%<br />
redwood trust inc Financials 32 145 042 0.67% 0.67%<br />
regal entertainment Group Consumer services 62 764 376 0.24% 0.57%<br />
regal-beloit Corp industrials 195 134 670 1.54% 1.54%<br />
regency Centers Corp Financials 134 706 098 0.67% 0.67%<br />
regeneron Pharmaceuticals inc Health Care 198 199 906 0.54% 0.65%<br />
regions Financial Corp Financials 62 692 846 0.19% 0.19%<br />
regis Corp Consumer services 38 568 530 0.68% 0.68%<br />
reinsurance Group <strong>of</strong> america inc Financials 155 072 013 0.68% 0.68%<br />
reliance steel & aluminum Co basic m<strong>at</strong>erials 145 964 178 0.67% 0.67%<br />
renaissancere <strong>Holding</strong>s ltd Financials 158 011 543 0.69% 0.69%<br />
renasant Corp Financials 16 173 532 0.72% 0.72%<br />
rent-a-Center inc/tX Consumer services 93 170 764 0.72% 0.72%<br />
republic airways <strong>Holding</strong>s inc Consumer services 106 833 0.01% 0.01%<br />
republic bancorp inc/KY Financials 13 734 802 0.24% 0.48%<br />
republic services inc industrials 591 656 793 0.97% 0.97%<br />
resaca exploit<strong>at</strong>ion inc oil & Gas 417 757 0.41% 0.41%<br />
resmed inc Health Care 370 599 453 0.40% 1.67%<br />
resources Connection inc industrials 20 569 707 0.74% 0.74%<br />
rex energy Corp oil & Gas 22 200 904 0.57% 0.57%<br />
rF micro Devices inc technology 61 047 <strong>31</strong>2 0.68% 0.68%<br />
rigel Pharmaceuticals inc Health Care 22 240 568 0.66% 0.66%<br />
rite aid Corp Consumer services 33 047 521 0.49% 0.49%<br />
riverbed technology inc technology 150 283 168 0.69% 0.69%<br />
rli Corp Financials 63 799 239 0.70% 0.70%<br />
rlJ lodging trust Financials 48 913 366 0.46% 0.46%<br />
robbins & myers inc industrials 83 204 907 0.63% 0.63%<br />
robert Half intern<strong>at</strong>ional inc industrials 166 652 849 0.69% 0.69%<br />
rock-tenn Co industrials 203 128 355 0.84% 0.84%<br />
rockwell autom<strong>at</strong>ion inc industrials 415 826 630 0.67% 0.67%<br />
rockwell Collins inc industrials 338 7<strong>31</strong> <strong>31</strong>0 0.69% 0.69%<br />
rockwood <strong>Holding</strong>s inc basic m<strong>at</strong>erials 120 715 880 0.67% 0.67%<br />
r<strong>of</strong>in-sinar technologies inc industrials 24 389 083 0.63% 0.63%<br />
rogers Corp industrials 23 641 104 0.66% 0.66%<br />
rollins inc Consumer services 64 792 460 0.33% 0.33%<br />
roper industries inc industrials 328 977 076 0.66% 0.66%<br />
rosetta resources inc oil & Gas 96 499 120 0.70% 0.70%<br />
ross stores inc Consumer services 219 523 594 0.34% 0.34%<br />
rovi Corp technology 110 912 807 0.69% 0.69%<br />
rowan Cos inc oil & Gas 156 643 895 0.69% 0.69%<br />
royal Caribbean Cruises ltd Consumer services 163 503 525 0.51% 0.51%<br />
royal Gold inc basic m<strong>at</strong>erials 149 674 467 0.68% 0.68%<br />
rPC inc oil & Gas 42 642 217 0.26% 0.26%<br />
rPm intern<strong>at</strong>ional inc basic m<strong>at</strong>erials 127 702 786 0.67% 0.67%<br />
rr Donnelley & sons Co industrials 108 584 287 0.67% 0.67%<br />
rsC <strong>Holding</strong>s inc industrials 23 393 051 0.20% 0.20%<br />
rti intern<strong>at</strong>ional metals inc basic m<strong>at</strong>erials 27 567 340 0.66% 0.66%<br />
rubicon technology inc industrials 13 107 534 1.04% 1.04%<br />
ruby tuesday inc Consumer services 18 126 150 0.69% 0.69%<br />
ruddick Corp Consumer services 63 115 253 0.50% 0.50%<br />
rudolph technologies inc technology 10 249 558 0.58% 0.58%<br />
rush enterprises inc Consumer services 23 366 710 0.08% 0.49%<br />
ryder system inc industrials 111 207 847 0.69% 0.69%<br />
ryland Group inc Consumer Goods 29 968 428 0.72% 0.72%<br />
s&t bancorp inc Financials 24 514 019 0.75% 0.75%<br />
s1 Corp technology 36 992 844 1.17% 1.17%<br />
sabra Health Care reit inc Financials 18 574 944 0.70% 0.70%<br />
safety insurance Group inc Financials 24 687 328 0.67% 0.67%<br />
safeway inc Consumer services 123 258 650 0.29% 0.29%<br />
saiC inc technology 169 678 147 0.68% 0.68%<br />
saks inc Consumer services 63 908 334 0.69% 0.69%<br />
salesforce.com inc technology 440 954 086 0.54% 0.54%<br />
salix Pharmaceuticals ltd Health Care 113 700 835 0.67% 0.67%<br />
sally beauty <strong>Holding</strong>s inc Consumer services 116 439 527 0.50% 0.50%<br />
sanderson Farms inc Consumer Goods 43 565 920 0.65% 0.65%<br />
sanDisk Corp technology 1 944 585 841 2.76% 2.76%<br />
sandridge energy inc oil & Gas 146 796 236 0.73% 0.73%<br />
sandy spring bancorp inc Financials 15 887 635 0.63% 0.63%<br />
sanmina-sCi Corp industrials 28 014 611 0.62% 0.62%<br />
sapient Corp technology 53 044 4<strong>31</strong> 0.50% 0.50%<br />
sara lee Corp Consumer Goods 447 610 342 0.67% 0.67%<br />
sauer-Danfoss inc industrials 21 021 940 0.20% 0.20%<br />
saul Centers inc Financials 19 3<strong>31</strong> 562 0.47% 0.47%<br />
savient Pharmaceuticals inc Health Care 5 605 885 0.59% 0.59%<br />
sba Communic<strong>at</strong>ions Corp telecommunic<strong>at</strong>ions 13 551 900 0.05% 0.05%<br />
sCana Corp utilities 132 267 325 0.38% 0.38%<br />
scansource inc technology 39 713 676 0.68% 0.68%<br />
schawk inc Consumer services 7 351 452 0.43% 0.43%<br />
schlumberger ltd oil & Gas 4 158 765 042 0.76% 0.76%<br />
schnitzer steel industries inc industrials 43 093 060 0.28% 0.61%<br />
scholastic Corp Consumer services 38 747 577 0.74% 0.70%<br />
school specialty inc industrials 58 441 0.02% 0.02%<br />
schweitzer-mauduit intern<strong>at</strong>ional inc Consumer Goods 45 389 936 0.71% 0.71%<br />
scientific Games Corp Consumer services 28 010 169 0.53% 0.53%<br />
scotts miracle-Gro Co/the Consumer Goods 91 182 491 0.54% 0.54%<br />
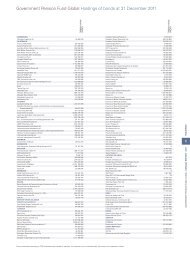
Country associ<strong>at</strong>ion according to Ftse (the benchmark provider for <strong>equities</strong>). if a company is not in the benchmark, the country <strong>of</strong> incorpor<strong>at</strong>ion is listed. sector classific<strong>at</strong>ion according to iCb (the industry Classific<strong>at</strong>ion<br />
benchmark company).<br />
voting<br />
ownership<br />
HOLdiNgs<br />
43<br />
<strong>Government</strong> <strong>Pension</strong> FunD <strong>Global</strong> ANNUAL REPORT 2011