Government Pension Fund Global Holding of equities at 31 ... - NBIM
Government Pension Fund Global Holding of equities at 31 ... - NBIM
Government Pension Fund Global Holding of equities at 31 ... - NBIM

Create successful ePaper yourself
Turn your PDF publications into a flip-book with our unique Google optimized e-Paper software.
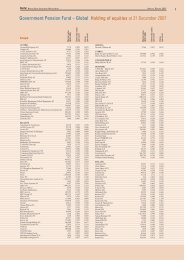
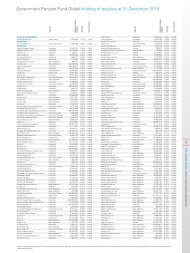
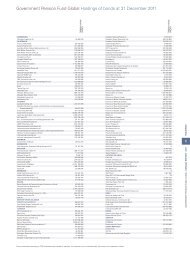
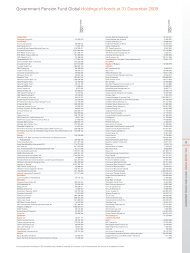
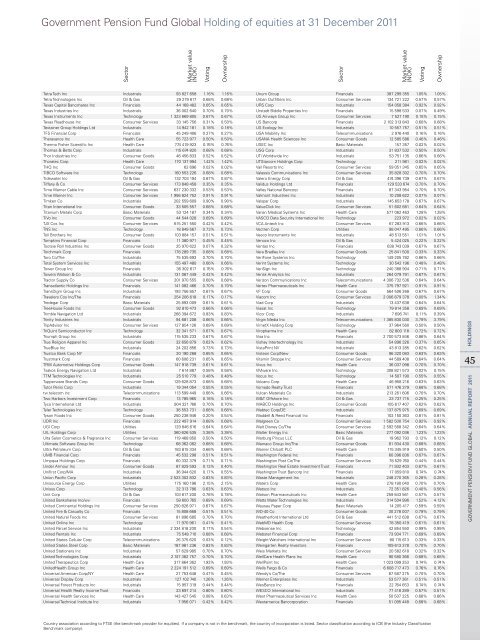
<strong>Government</strong> <strong>Pension</strong> <strong>Fund</strong> <strong>Global</strong> <strong>Holding</strong> <strong>of</strong> <strong>equities</strong> <strong>at</strong> <strong>31</strong> December 2011<br />
sector<br />
market value<br />
(noK)<br />
tetra tech inc industrials 93 827 658 1.16% 1.16%<br />
tetra technologies inc oil & Gas 29 279 617 0.68% 0.68%<br />
texas Capital bancshares inc Financials 44 168 482 0.65% 0.65%<br />
texas industries inc industrials 36 002 640 0.70% 0.70%<br />
texas instruments inc technology 1 323 669 805 0.67% 0.67%<br />
texas roadhouse inc Consumer services 33 145 756 0.<strong>31</strong>% 0.50%<br />
textainer Group <strong>Holding</strong>s ltd industrials 14 942 181 0.18% 0.18%<br />
tFs Financial Corp Financials 45 249 406 0.27% 0.27%<br />
theravance inc Health Care 55 723 977 0.50% 0.50%<br />
thermo Fisher scientific inc Health Care 774 419 923 0.76% 0.76%<br />
thomas & betts Corp industrials 115 674 820 0.68% 0.68%<br />
thor industries inc Consumer Goods 46 456 833 0.52% 0.52%<br />
thor<strong>at</strong>ec Corp Health Care 170 137 994 1.42% 1.42%<br />
tHQ inc Consumer Goods 62 696 0.02% 0.02%<br />
tibCo s<strong>of</strong>tware inc technology 160 553 226 0.68% 0.68%<br />
tidew<strong>at</strong>er inc oil & Gas 132 703 194 0.87% 0.87%<br />
tiffany & Co Consumer services 173 848 458 0.35% 0.35%<br />
time Warner Cable inc Consumer services 637 230 332 0.53% 0.53%<br />
time Warner inc Consumer services 1 956 824 752 0.91% 0.91%<br />
timken Co industrials 202 559 609 0.90% 0.90%<br />
titan intern<strong>at</strong>ional inc Consumer Goods 33 505 557 0.68% 0.68%<br />
titanium metals Corp basic m<strong>at</strong>erials 53 124 187 0.34% 0.34%<br />
tivo inc Consumer Goods 44 544 028 0.69% 0.69%<br />
tJX Cos inc Consumer services 615 251 550 0.42% 0.42%<br />
tns inc technology 18 849 567 0.73% 0.73%<br />
toll brothers inc Consumer Goods 103 884 157 0.51% 0.51%<br />
tompkins Financial Corp Financials 11 380 971 0.45% 0.45%<br />
tootsie roll industries inc Consumer Goods 25 970 622 0.07% 0.32%<br />
torchmark Corp Financials 178 289 735 0.68% 0.68%<br />
toro Co/the industrials 75 535 693 0.70% 0.70%<br />
total system services inc industrials 155 497 480 0.66% 0.66%<br />
tower Group inc Financials 36 302 617 0.76% 0.76%<br />
towers W<strong>at</strong>son & Co industrials 1<strong>31</strong> 067 449 0.42% 0.42%<br />
tractor supply Co Consumer services 201 970 555 0.68% 0.68%<br />
trans<strong>at</strong>lantic <strong>Holding</strong>s inc Financials 141 082 466 0.70% 0.70%<br />
transDigm Group inc industrials 193 756 857 0.67% 0.67%<br />
travelers Cos inc/the Financials 254 206 618 0.17% 0.17%<br />
tredegar Corp basic m<strong>at</strong>erials 25 893 009 0.61% 0.61%<br />
treeHouse Foods inc Consumer Goods 92 810 473 0.66% 0.66%<br />
trimble navig<strong>at</strong>ion ltd industrials 266 394 672 0.83% 0.83%<br />
trinity industries inc industrials 94 681 208 0.66% 0.66%<br />
tripadvisor inc Consumer services 127 854 126 0.69% 0.69%<br />
triQuint semiconductor inc technology 32 341 571 0.67% 0.67%<br />
triumph Group inc industrials 115 535 233 0.67% 0.67%<br />
true religion apparel inc Consumer Goods 32 656 879 0.62% 0.62%<br />
trueblue inc industrials 24 202 856 0.73% 0.73%<br />
trustco bank Corp nY Financials 20 190 268 0.65% 0.65%<br />
trustmark Corp Financials 60 606 2<strong>31</strong> 0.65% 0.65%<br />
trW automotive <strong>Holding</strong>s Corp Consumer Goods 147 918 739 0.61% 0.61%<br />
tsakos energy navig<strong>at</strong>ion ltd industrials 7 614 887 0.58% 0.58%<br />
ttm technologies inc industrials 25 510 779 0.48% 0.48%<br />
tupperware brands Corp Consumer Goods 129 628 873 0.68% 0.68%<br />
tutor Perini Corp industrials 19 344 054 0.55% 0.55%<br />
tw telecom inc telecommunic<strong>at</strong>ions 113 599 449 0.66% 0.66%<br />
two Harbors investment Corp Financials 13 785 965 0.18% 0.18%<br />
tyco intern<strong>at</strong>ional ltd industrials 904 321 766 0.70% 0.70%<br />
tyler technologies inc technology 36 553 7<strong>31</strong> 0.68% 0.68%<br />
tyson Foods inc Consumer Goods 250 238 946 0.20% 0.54%<br />
uDr inc Financials 222 497 914 0.68% 0.68%<br />
uGi Corp utilities 129 846 616 0.64% 0.64%<br />
uil <strong>Holding</strong>s Corp utilities 360 626 535 3.38% 3.38%<br />
ulta salon Cosmetics & Fragrance inc Consumer services 119 468 850 0.50% 0.50%<br />
ultim<strong>at</strong>e s<strong>of</strong>tware Group inc technology 68 362 082 0.68% 0.68%<br />
ultra Petroleum Corp oil & Gas 183 815 334 0.68% 0.68%<br />
umb Financial Corp Financials 45 532 298 0.51% 0.51%<br />
umpqua <strong>Holding</strong>s Corp Financials 60 332 379 0.71% 0.71%<br />
under armour inc Consumer Goods 87 829 593 0.13% 0.40%<br />
unifirst Corp/ma industrials 36 944 620 0.17% 0.55%<br />
union Pacific Corp industrials 2 523 302 832 0.83% 0.83%<br />
unisource energy Corp utilities 175 160 196 2.15% 2.15%<br />
unisys Corp technology 32 <strong>31</strong>3 786 0.63% 0.63%<br />
unit Corp oil & Gas 103 617 200 0.78% 0.78%<br />
united bankshares inc/wv Financials 58 600 765 0.69% 0.69%<br />
united Continental <strong>Holding</strong>s inc Consumer services 250 826 971 0.67% 0.67%<br />
united Fire & Casualty Co Financials 15 808 668 0.51% 0.51%<br />
united n<strong>at</strong>ural Foods inc Consumer services 81 896 685 0.70% 0.70%<br />
united online inc technology 11 970 961 0.41% 0.41%<br />
united Parcel service inc industrials 2 334 818 200 0.17% 0.54%<br />
united rentals inc industrials 75 548 710 0.68% 0.68%<br />
united st<strong>at</strong>es Cellular Corp telecommunic<strong>at</strong>ions 26 375 620 0.03% 0.12%<br />
united st<strong>at</strong>es steel Corp basic m<strong>at</strong>erials 187 981 236 0.83% 0.83%<br />
united st<strong>at</strong>ioners inc industrials 57 629 985 0.70% 0.70%<br />
united technologies Corp industrials 2 747 382 757 0.70% 0.70%<br />
united therapeutics Corp Health Care <strong>31</strong>7 864 362 1.93% 1.93%<br />
unitedHealth Group inc Health Care 2 224 191 512 0.69% 0.69%<br />
universal american Corp/nY Health Care 27 753 648 0.47% 0.45%<br />
universal Display Corp industrials 127 102 740 1.26% 1.26%<br />
universal Forest Products inc industrials 15 957 <strong>31</strong>9 0.44% 0.44%<br />
universal Health realty income trust Financials 23 697 214 0.80% 0.80%<br />
universal Health services inc Health Care 143 427 545 0.08% 0.63%<br />
universal technical institute inc industrials 7 956 071 0.42% 0.42%<br />
voting<br />
ownership<br />
sector<br />
market value<br />
(noK)<br />
unum Group Financials 387 299 355 1.05% 1.05%<br />
urban outfitters inc Consumer services 134 721 222 0.57% 0.57%<br />
urs Corp industrials 154 058 384 0.92% 0.92%<br />
urstadt biddle Properties inc Financials 15 598 533 0.07% 0.49%<br />
us airways Group inc Consumer services 7 527 190 0.15% 0.15%<br />
us bancorp Financials 2 102 <strong>31</strong>3 843 0.68% 0.68%<br />
us ecology inc industrials 10 557 757 0.51% 0.51%<br />
usa mobility inc telecommunic<strong>at</strong>ions 2 976 440 0.16% 0.16%<br />
usana Health sciences inc Consumer Goods 12 585 586 0.46% 0.46%<br />
useC inc basic m<strong>at</strong>erials 157 357 0.02% 0.02%<br />
usG Corp industrials <strong>31</strong> 837 532 0.50% 0.50%<br />
uti Worldwide inc industrials 53 751 135 0.66% 0.66%<br />
utstarcom <strong>Holding</strong>s Corp technology 211 981 0.02% 0.02%<br />
vail resorts inc Consumer services 59 051 345 0.65% 0.65%<br />
valassis Communic<strong>at</strong>ions inc Consumer services 35 828 302 0.70% 0.70%<br />
valero energy Corp oil & Gas 474 396 739 0.67% 0.67%<br />
validus <strong>Holding</strong>s ltd Financials 129 533 674 0.70% 0.70%<br />
valley n<strong>at</strong>ional bancorp Financials 87 343 954 0.70% 0.70%<br />
valmont industries inc industrials 10 208 622 0.07% 0.07%<br />
valspar Corp industrials 145 653 178 0.67% 0.67%<br />
valueClick inc Consumer services 51 602 681 0.64% 0.64%<br />
varian medical systems inc Health Care 577 062 463 1.28% 1.28%<br />
vasCo D<strong>at</strong>a security intern<strong>at</strong>ional inc technology 223 972 0.02% 0.02%<br />
vCa antech inc Consumer services 67 283 913 0.66% 0.66%<br />
vectren Corp utilities 98 047 495 0.66% 0.66%<br />
veeco instruments inc industrials 48 513 551 1.01% 1.01%<br />
venoco inc oil & Gas 5 424 025 0.22% 0.22%<br />
ventas inc Financials 638 743 039 0.67% 0.67%<br />
vera bradley inc Consumer Goods 25 841 500 0.33% 0.33%<br />
veriFone systems inc technology 149 205 782 0.66% 0.66%<br />
verint systems inc technology 30 542 196 0.48% 0.48%<br />
verisign inc technology 240 388 904 0.71% 0.71%<br />
verisk analytics inc industrials 264 079 791 0.67% 0.67%<br />
verizon Communic<strong>at</strong>ions inc telecommunic<strong>at</strong>ions 4 306 732 536 0.64% 0.64%<br />
vertex Pharmaceuticals inc Health Care 375 797 921 0.91% 0.91%<br />
vF Corp Consumer Goods 564 506 268 0.67% 0.67%<br />
viacom inc Consumer services 2 006 879 378 0.00% 1.34%<br />
viad Corp industrials 13 437 638 0.64% 0.64%<br />
vias<strong>at</strong> inc technology 79 814 358 0.69% 0.69%<br />
vicor Corp industrials 7 696 741 0.11% 0.39%<br />
virgin media inc telecommunic<strong>at</strong>ions 1 385 830 030 3.79% 3.79%<br />
virnetX <strong>Holding</strong> Corp technology 37 964 560 0.50% 0.50%<br />
viropharma inc Health Care 82 800 118 0.72% 0.72%<br />
visa inc Financials 2 700 573 846 0.86% 0.64%<br />
vishay intertechnology inc industrials 54 896 326 0.37% 0.65%<br />
vistaPrint nv industrials 43 813 285 0.62% 0.62%<br />
visteon Corp/new Consumer Goods 96 320 083 0.63% 0.63%<br />
vitamin shoppe inc Consumer services 44 589 408 0.64% 0.64%<br />
vivus inc Health Care 36 037 098 0.70% 0.70%<br />
vmware inc technology 308 821 573 0.02% 0.15%<br />
vocus inc technology 14 507 190 0.55% 0.55%<br />
volcano Corp Health Care 46 958 216 0.63% 0.63%<br />
vornado realty trust Financials 571 476 379 0.68% 0.68%<br />
vulcan m<strong>at</strong>erials Co industrials 213 261 606 0.70% 0.70%<br />
W&t <strong>of</strong>fshore inc oil & Gas 23 737 715 0.25% 0.25%<br />
WabCo <strong>Holding</strong>s inc Consumer Goods 105 617 407 0.62% 0.62%<br />
Wabtec Corp/De industrials 137 875 975 0.69% 0.69%<br />
Waddell & reed Financial inc Financials 102 150 363 0.81% 0.81%<br />
Walgreen Co Consumer services 1 582 500 754 0.92% 0.92%<br />
Walt Disney Co/the Consumer services 2 592 568 342 0.64% 0.64%<br />
Walter energy inc basic m<strong>at</strong>erials 277 092 036 1.23% 1.23%<br />
Warburg Pincus llC oil & Gas 19 962 793 0.12% 0.12%<br />
Warnaco Group inc/the Consumer Goods 81 934 430 0.68% 0.68%<br />
Warner Chilcott PlC Health Care 115 345 919 0.50% 0.50%<br />
Washington Federal inc Financials 60 396 836 0.67% 0.67%<br />
Washington Post Co/the Consumer services 78 529 760 0.44% 0.44%<br />
Washington real est<strong>at</strong>e investment trust Financials 71 932 403 0.67% 0.67%<br />
Washington trust bancorp inc Financials 17 059 810 0.74% 0.74%<br />
Waste management inc industrials 248 270 365 0.28% 0.28%<br />
W<strong>at</strong>ers Corp Health Care 278 180 040 0.70% 0.70%<br />
W<strong>at</strong>sco inc industrials 72 351 826 0.40% 0.56%<br />
W<strong>at</strong>son Pharmaceuticals inc Health Care 259 843 561 0.57% 0.57%<br />
W<strong>at</strong>ts W<strong>at</strong>er technologies inc industrials <strong>31</strong>4 504 996 1.52% 4.12%<br />
Wausau Paper Corp basic m<strong>at</strong>erials 14 205 417 0.59% 0.59%<br />
WD-40 Co Consumer Goods 30 278 007 0.79% 0.79%<br />
We<strong>at</strong>herford intern<strong>at</strong>ional ltd oil & Gas 441 512 638 0.67% 0.67%<br />
WebmD Health Corp Consumer services 78 350 419 0.61% 0.61%<br />
Websense inc technology 42 854 550 0.99% 0.99%<br />
Webster Financial Corp Financials 73 934 771 0.69% 0.69%<br />
Weight W<strong>at</strong>chers intern<strong>at</strong>ional inc Consumer services 80 115 613 0.33% 0.33%<br />
Weingarten realty investors Financials 109 613 378 0.70% 0.70%<br />
Weis markets inc Consumer services 20 582 618 0.32% 0.32%<br />
WellCare Health Plans inc Health Care 90 580 366 0.68% 0.68%<br />
WellPoint inc Health Care 1 023 099 253 0.74% 0.74%<br />
Wells Fargo & Co Financials 6 608 717 473 0.76% 0.76%<br />
Wendy’s Co/the Consumer services 87 587 275 0.70% 0.70%<br />
Werner enterprises inc industrials 53 577 361 0.51% 0.51%<br />
Wesbanco inc Financials 22 764 653 0.74% 0.74%<br />
WesCo intern<strong>at</strong>ional inc industrials 77 418 289 0.57% 0.51%<br />
West Pharmaceutical services inc Health Care 50 507 225 0.66% 0.66%<br />
Westamerica bancorpor<strong>at</strong>ion Financials 51 095 448 0.68% 0.68%<br />
Country associ<strong>at</strong>ion according to Ftse (the benchmark provider for <strong>equities</strong>). if a company is not in the benchmark, the country <strong>of</strong> incorpor<strong>at</strong>ion is listed. sector classific<strong>at</strong>ion according to iCb (the industry Classific<strong>at</strong>ion<br />
benchmark company).<br />
voting<br />
ownership<br />
HOLdiNgs<br />
45<br />
<strong>Government</strong> <strong>Pension</strong> FunD <strong>Global</strong> ANNUAL REPORT 2011