01 05 09 02 06 10 03 07 11 04 08 12 13 14
01 05 09 02 06 10 03 07 11 04 08 12 13 14
01 05 09 02 06 10 03 07 11 04 08 12 13 14

You also want an ePaper? Increase the reach of your titles
YUMPU automatically turns print PDFs into web optimized ePapers that Google loves.
<strong>01</strong><br />
<strong>02</strong><br />
<strong>03</strong><br />
<strong>04</strong><br />
<strong>05</strong><br />
<strong>06</strong><br />
<strong>07</strong><br />
<strong>08</strong><br />
<strong>09</strong><br />
<strong>10</strong><br />
<strong>11</strong><br />
<strong>12</strong><br />
<strong>13</strong><br />
<strong>14</strong><br />
84<br />
<strong>06</strong><br />
Consolidated information<br />
Fiscal 2<strong>01</strong>1 Activity Report<br />
2.3 Net financing costs<br />
Net financing costs decreased from 150 million euro<br />
in Fiscal 2<strong>01</strong>0 to <strong>14</strong>7 million euro in Fiscal 2<strong>01</strong>1,<br />
notably as a result of favorable effects of movements<br />
in the discounting rate of pension liabilities.<br />
2.4 Income tax expense<br />
Income tax expense totaled 250 million euro, with<br />
an effective tax rate of 35.4%, as compared to the<br />
prior year rate of 33%. The difference compared<br />
to the prior year resulted from the <strong>14</strong> million euro<br />
reduction in the utilization of tax loss carryforwards<br />
in several countries.<br />
2.5 Profit attributable to equity<br />
holders of the parent<br />
Profit attributable to equity holders of the parent<br />
was 451 million euro, compared to 4<strong>09</strong> million<br />
euro in the prior year, an increase of <strong>10</strong>.3% or 9.3%<br />
excluding exchange rate effects. The increase was<br />
3. FINANCIAL POSITION OF THE GROUP<br />
3.1 Cash flows<br />
Sodexo Registration Document Fiscal 2<strong>01</strong>1<br />
slightly less than for operating profit, mainly due to<br />
the rise in the effective tax rate.<br />
2.6 Earnings per share<br />
Earnings per share was 2.95 euro, an increase of<br />
<strong>11</strong>.7% at current exchange rates and <strong>10</strong>.6% excluding<br />
exchange rate effects. This item rose faster than net<br />
income because of the increase in the number of<br />
treasury shares compared to the prior year. Treasury<br />
shares are excluded from the calculation of earnings<br />
per share.<br />
2.7 Dividend<br />
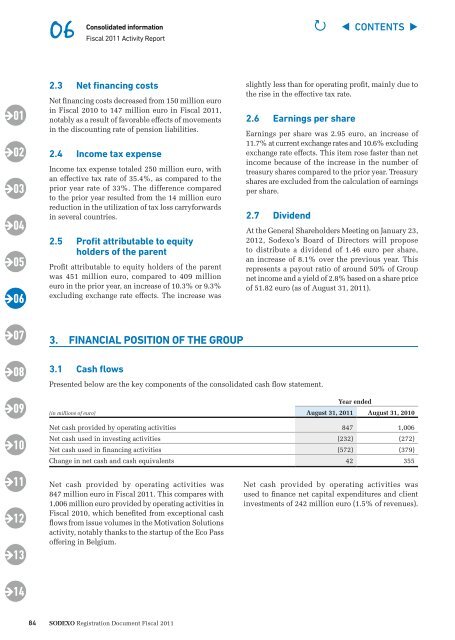
Presented below are the key components of the consolidated cash flow statement.<br />
(in millions of euro)<br />
At the General Shareholders Meeting on January 23,<br />
2<strong>01</strong>2, Sodexo’s Board of Directors will propose<br />
to distribute a dividend of 1.46 euro per share,<br />
an increase of 8.1% over the previous year. This<br />
represents a payout ratio of around 50% of Group<br />
net income and a yield of 2.8% based on a share price<br />
of 51.82 euro (as of August 31, 2<strong>01</strong>1).<br />
Year ended<br />
August 31, 2<strong>01</strong>1 August 31, 2<strong>01</strong>0<br />
Net cash provided by operating activities 847 1,0<strong>06</strong><br />
Net cash used in investing activities (232) (272)<br />
Net cash used in financing activities (572) (379)<br />
Change in net cash and cash equivalents 42 355<br />
Net cash provided by operating activities was<br />
847 million euro in Fiscal 2<strong>01</strong>1. This compares with<br />
1,0<strong>06</strong> million euro provided by operating activities in<br />
Fiscal 2<strong>01</strong>0, which benefited from exceptional cash<br />
flows from issue volumes in the Motivation Solutions<br />
activity, notably thanks to the startup of the Eco Pass<br />
offering in Belgium.<br />
P ◀ CONTENTS ▶<br />
Net cash provided by operating activities was<br />
used to finance net capital expenditures and client<br />
investments of 242 million euro (1.5% of revenues).