atw 2018-10

Create successful ePaper yourself
Turn your PDF publications into a flip-book with our unique Google optimized e-Paper software.
<strong>atw</strong> Vol. 63 (<strong>2018</strong>) | Issue <strong>10</strong> ı October<br />
Highlights of the World Nuclear<br />
Performance Report <strong>2018</strong><br />
Jonathan Cobb<br />
There is no sustainable energy future without nuclear energy. To meet the growing demand for reliable, affordable<br />
and clean electricity, we will need all low-carbon energy sources to work together.<br />
Nuclear capacity must expand to achieve this. The nuclear<br />
industry’s Harmony goal is for 25 % of the world’s<br />
electricity to be supplied from nuclear energy by 2050 as<br />
part of a low-carbon mix.<br />
The World Nuclear Performance Report, published<br />
annually by World Nuclear Association, records current<br />
progress towards the Harmony goal. The report is based on<br />
performance data from the IAEA PRIS database, combined<br />
with the association’s own research.<br />
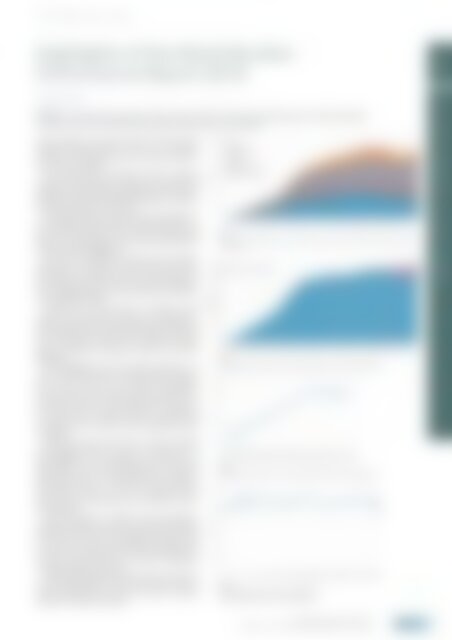
The world’s nuclear reactors performed excellently in<br />
2017. Global generation reached a total of 2506 TWh, up<br />
from 2477 TWh in 2016. This is the fifth successive year<br />
that nuclear generation has risen, with output 160 TWh<br />
higher than in 2012 (Figure 1).<br />
The total net capacity of nuclear power in operation<br />
during 2017 was 394 GWe, up from 391 GWe in 2016.<br />
These figures are higher than the end of year capacity as<br />
they include those reactors that were closed during each<br />
year. The global capacity at the end of 2017 was 392 GWe,<br />
up from 390 GW in 2016.<br />
Usually only a small fraction of operable nuclear<br />
capacity does not generate electricity in a calendar year.<br />
However, since 2011, most of the Japanese reactor fleet has<br />
been awaiting restart. Two reactors restarted in 2017 and<br />
more are expected in <strong>2018</strong>. The net capacity of nuclear<br />
plant that generated electricity in 2017 was 352 GWe<br />
(Figure 2).<br />
To meaningfully assess the global performance of<br />
reactors the World Nuclear Performance Report excludes<br />
those reactors that have not generated throughout<br />
the year, such as those reactors that are categorized as<br />
operable in Japan but are still awaiting approval to restart.<br />
For reactors that were grid connected or permanently<br />
shut down during a calendar year their capacity factor<br />
is calculated on the basis of their performance when<br />
operational.<br />
Taking these issues into account, in 2017, the global<br />
average capacity factor was 81.1 %, up from 80.5 % in<br />
2016 (Figure 3). This maintains the high level of<br />
performance seen since 2000 following the substantial<br />
improvement seen over the preceding years. In general, a<br />
high capacity factor is a reflection of good operation<br />
performance. However, there is an increasing trend in<br />
some countries for nuclear reactors to operate in a loadfollowing<br />
mode.<br />
One key question is whether reactor performance<br />
degrades overtime as reactors age. A review of the capacity<br />
factors achieved by all reactors in operation shows that this<br />
is not the case. There is no significant age-related trend<br />
in nuclear reactor performance. The mean capacity factor<br />
for reactors over the last five years shows no significant<br />
variation regardless of their age.<br />
While electricity generation from nuclear power plants<br />
has increased globally over the last five years, there are<br />
regional differences that reflect the status of nuclear<br />
energy in those different regions.<br />
| | Fig. 1.<br />
Nuclear electricity production. Source: World Nuclear Association and IAEA Power Reactor Information<br />
Service (PRIS)<br />
| | Fig. 2.<br />
Nuclear generation capacity (net). Source: World Nuclear Association and IAEA PRIS<br />
| | Fig. 3.<br />
Global average capacity factor. Source: World Nuclear Association and IAEA PRIS<br />
| | Fig. 4.<br />
Mean Capacity Factor 2012-2017 by Age of Reactor.<br />
Source: World Nuclear Association and IAEA PRIS<br />
505<br />
ENERGY POLICY, ECONOMY AND LAW<br />
Energy Policy, Economy and Law<br />
Highlights of the World Nuclear Performance Report <strong>2018</strong> ı Jonathan Cobb