


You also want an ePaper? Increase the reach of your titles
YUMPU automatically turns print PDFs into web optimized ePapers that Google loves.
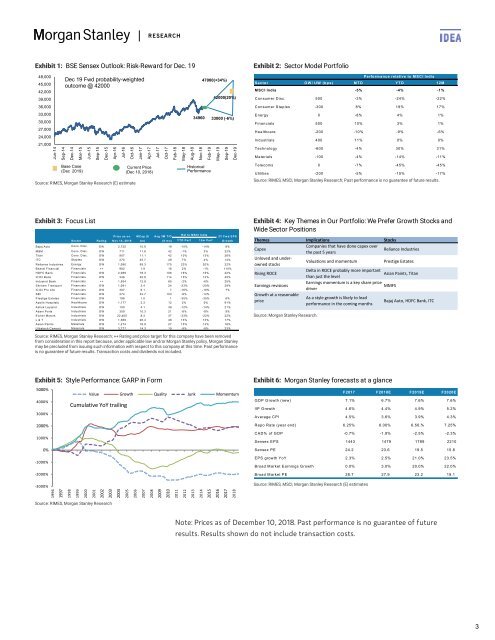
Exhibit 1: BSE Sensex Outlook: Risk-Reward for Dec. 19<br />
48,000<br />
45,000<br />
42,000<br />
39,000<br />
36,000<br />
33,000<br />
30,000<br />
27,000<br />
24,000<br />
21,000<br />
Jun-14<br />
Sep-14<br />
Dec 19 Fwd probability-weighted<br />
outcome @ 42000<br />
Dec-14<br />
Mar-15<br />
Base Case<br />
(Dec 2019)<br />
Jun-15<br />
Sep-15<br />
Dec-15<br />
Apr-16<br />
Jul-16<br />
Oct-16<br />
Source: RIMES, Morgan Stanley Research (E) estimate<br />
Jan-17<br />
Apr-17<br />
Current Price<br />
(Dec 10, 2018)<br />
Jul-17<br />
Oct-17<br />
Feb-18<br />
May-18<br />
Aug-18<br />
34960<br />
Nov-18<br />
47000(+34%)<br />
Feb-19<br />
Historical<br />
Performance<br />
42000(20%)<br />
33000 (-6%)<br />
May-19<br />
Sep-19<br />
Dec-19<br />
Exhibit 2: Sector Model Portfolio<br />
Perform ance relative to M SC I India<br />
Sector O W / U W (bps) M T D YT D 12M<br />
M SC I India -5% -4% -1%<br />
C onsumer D isc. 500 -3% -24% -22%<br />
C onsumer Staples -300 8% 19% 17%<br />
Energy 0 -8% 4% 1%<br />
Financials 500 10% 3% 1%<br />
H ealthcare -200 -10% -9% -6%<br />
Industrials 400 11% 0% 0%<br />
Technology -600 -4% 30% 31%<br />
M aterials -100 -4% -14% -11%<br />
Telecoms 0 -7% -45% -45%<br />
U tilities -200 -5% -15% -17%<br />
Source: RIMES, MSCI, Morgan Stanley Research; Past performance is no guarantee of future results.<br />
Exhibit 3: Focus List<br />
Sector<br />
R ating<br />
Price as on<br />
N ov 14, 2018<br />
M C ap ($<br />
Avg 3M T /O<br />
R el to M SC I India<br />
YT D Perf<br />
12m Perf<br />
Bajaj Auto C ons. D isc. EW 2,725 10.9 19 -15% -14% 8%<br />
M &M C ons. D isc. O W 711 11.6 42 -1% 3% 22%<br />
Titan C ons. D isc. O W 907 11.1 42 10% 13% 26%<br />
ITC Staples O W 270 45.7 49 7% 4% 14%<br />
R eliance Industries Energy O W 1,090 95.3 175 23% 20% 22%<br />
Bharat Financial Financials ++ 982 1.9 18 2% -1% 110%<br />
H D FC Bank Financials O W 2,089 78.3 106 16% 15% 22%<br />
IC IC I Bank Financials O W 346 30.8 114 15% 13% 45%<br />
Indusind Bank Financials ++ 1,554 12.9 65 -2% -6% 25%<br />
Shriram Transport Financials O W 1,091 3.4 24 -23% -20% 29%<br />
IC IC I Pru Life Financials O W 307 6.1 7 -16% -18% 7%<br />
SBI Financials O W 274 33.7 103 -8% -12%<br />
2Y Fw d EPS<br />
Prestige Estates Financials O W 198 1.0 1 -35% -35% 6%<br />
Apollo H ospitals H ealthcare O W 1,177 2.3 12 2% 0% 91%<br />
Ashok Leyland Industrials O W 100 4.1 38 -12% -14% 21%<br />
Adani Ports Industrials O W 359 10.3 21 -8% -8% 9%<br />
Eicher M otors Industrials O W 22,405 8.4 37 -23% -22% 22%<br />
L & T Industrials O W 1,368 26.4 48 13% 13% 17%<br />
Asian Paints M aterials O W 1,274 16.9 27 15% 13% 16%<br />
U ltratech C ement M aterials O W 3,777 14.3 19 -9% -8% 23%<br />
bn)<br />
($ m n)<br />
G row th<br />
Source: RIMES, Morgan Stanley Research; ++ Rating and price target for this company have been removed<br />
from consideration in this report because, under applicable law and/or Morgan Stanley policy, Morgan Stanley<br />
may be precluded from issuing such information with respect to this company at this time. Past performance<br />
is no guarantee of future results. Transaction costs and dividends not included.<br />
Exhibit 4: Key Themes in Our Portfolio: We Prefer Growth Stocks and<br />
Wide Sector Positions<br />
Themes Implications Stocks<br />
Capex<br />
Companies that have done capex over<br />
the past 5 years<br />
Reliance Industries<br />
Unloved and underowned<br />
stocks<br />
Valuations and momentum<br />
Prestige Estates<br />
Rising ROCE<br />
Delta in ROCE probably more important<br />
Asian Paints, Titan<br />
Earnings revisions<br />
Growth at a reasonable<br />
price<br />
Source: Morgan Stanley Research.<br />
than just the level<br />
Earnings momentum is a key share price<br />
driver<br />
As a style growth is likely to lead<br />
performance in the coming months<br />
MMFS<br />
Bajaj Auto, HDFC Bank, ITC<br />
Exhibit 5: Style Performance: GARP in Form<br />
5000%<br />
4000%<br />
3000%<br />
2000%<br />
1000%<br />
0%<br />
-1000%<br />
-2000%<br />
-3000%<br />
Value Growth Quality Junk Momemtum<br />
Cumulative YoY trailing<br />
1996<br />
1997<br />
1998<br />
1999<br />
2000<br />
2001<br />
2002<br />
2003<br />
2004<br />
2005<br />
2006<br />
2007<br />
2008<br />
2009<br />
2010<br />
2011<br />
2012<br />
2013<br />
2014<br />
2015<br />
2016<br />
2017<br />
2018<br />
Source: RIMES, Morgan Stanley Research<br />
Exhibit 6: Morgan Stanley forecasts at a glance<br />
F2017 F2018E F2019E F2020E<br />
G DP G rowth (new) 7.1% 6.7% 7.6% 7.6%<br />
IIP G rowth 4.6% 4.4% 4.9% 5.2%<br />
Av erage CPI 4.5% 3.6% 3.9% 4.3%<br />
Repo Rate (year end) 6.25% 6.00% 6.50.% 7.25%<br />
CAD% of G DP -0.7% -1.9% -2.5% -2.3%<br />
Sensex EPS 1443 1479 1789 2210<br />
Sensex PE 24.2 23.6 19.5 15.8<br />
EPS growth YoY 2.3% 2.5% 21.0% 23.5%<br />
Broad M arket Earnings G rowth 0.0% 3.0% 20.0% 22.0%<br />
Broad M arket PE 28.7 27.9 23.2 19.1<br />
Source: RIMES, MSCI, Morgan Stanley Research (E) estimates<br />
Note: Prices as of December 10, 2018. Past performance is no guarantee of future<br />
results. Results shown do not include transaction costs.<br />
3


