


Create successful ePaper yourself
Turn your PDF publications into a flip-book with our unique Google optimized e-Paper software.
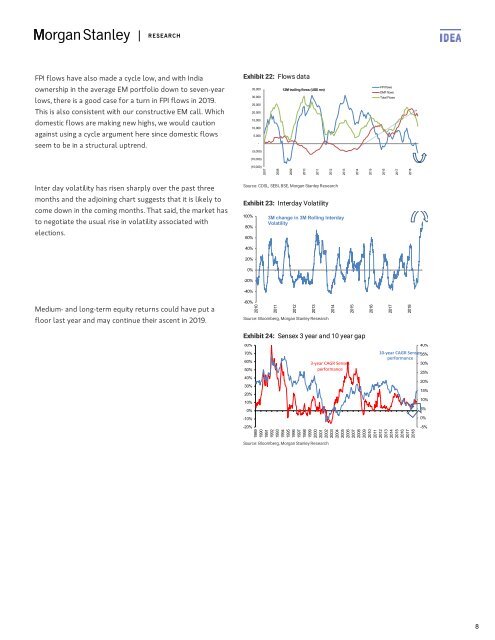
FPI flows have also made a cycle low, and with India<br />
ownership in the average EM portfolio down to seven-year<br />
lows, there is a good case for a turn in FPI flows in 2019.<br />
This is also consistent with our constructive EM call. Which<br />
domestic flows are making new highs, we would caution<br />
against using a cycle argument here since domestic flows<br />
seem to be in a structural uptrend.<br />
Exhibit 22: Flows data<br />
35,000<br />
12M trailing flows (US$ mn)<br />
30,000<br />
25,000<br />
20,000<br />
15,000<br />
10,000<br />
5,000<br />
-<br />
(5,000)<br />
(10,000)<br />
FPI flows<br />
DMF flows<br />
Total Flows<br />
(15,000)<br />
2007<br />
2008<br />
2009<br />
2010<br />
2011<br />
2012<br />
2013<br />
2014<br />
2015<br />
2016<br />
2017<br />
2018<br />
Inter day volatility has risen sharply over the past three<br />
months and the adjoining chart suggests that it is likely to<br />
come down in the coming months. That said, the market has<br />
to negotiate the usual rise in volatility associated with<br />
elections.<br />
Source: CDSL, SEBI, BSE, Morgan Stanley Research<br />
Exhibit 23: Interday Volatility<br />
100%<br />
80%<br />
60%<br />
3M change in 3M Rolling Interday<br />
Volatility<br />
40%<br />
20%<br />
0%<br />
-20%<br />
-40%<br />
Medium- and long-term equity returns could have put a<br />
floor last year and may continue their ascent in 2019.<br />
-60%<br />
2010<br />
2011<br />
2012<br />
2013<br />
2014<br />
Source: Bloomberg, Morgan Stanley Research<br />
2015<br />
2016<br />
2017<br />
2018<br />
Exhibit 24: Sensex 3 year and 10 year gap<br />
80%<br />
70%<br />
60%<br />
50%<br />
40%<br />
30%<br />
20%<br />
10%<br />
0%<br />
-10%<br />
-20%<br />
40%<br />
10-year CAGR Sensex35%<br />
performance<br />
30%<br />
1989<br />
1990<br />
1991<br />
1992<br />
1993<br />
1994<br />
1995<br />
1996<br />
1997<br />
1998<br />
1999<br />
2000<br />
2001<br />
2002<br />
2003<br />
2004<br />
2005<br />
2006<br />
2007<br />
2008<br />
2009<br />
2010<br />
2011<br />
2012<br />
2013<br />
2014<br />
2015<br />
2016<br />
2017<br />
2018<br />
Source: Bloomberg, Morgan Stanley Research<br />
3-year CAGR Sensex<br />
performance<br />
25%<br />
20%<br />
15%<br />
10%<br />
5%<br />
0%<br />
-5%<br />
8


