


You also want an ePaper? Increase the reach of your titles
YUMPU automatically turns print PDFs into web optimized ePapers that Google loves.
Assessing the Cycle - 2019 in Better Shape than 2018<br />
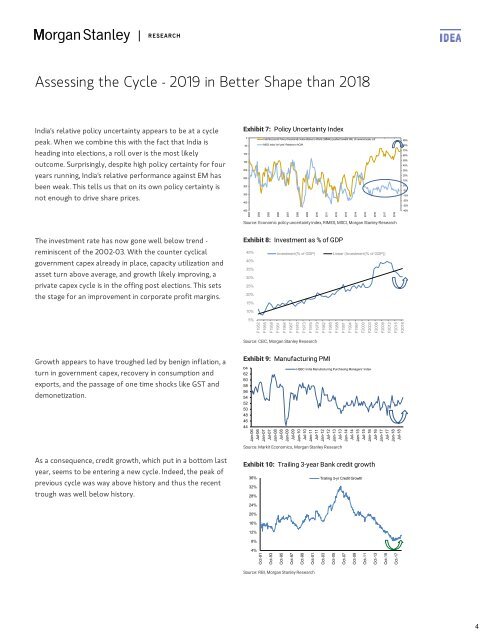
India's relative policy uncertainty appears to be at a cycle<br />
peak. When we combine this with the fact that India is<br />
heading into elections, a roll over is the most likely<br />
outcome. Surprisingly, despite high policy certainty for four<br />
years running, India's relative performance against EM has<br />
been weak. This tells us that on its own policy certainty is<br />
not enough to drive share prices.<br />
Exhibit 7: Policy Uncertainty Index<br />
0<br />
50<br />
100<br />
150<br />
200<br />
250<br />
300<br />
350<br />
400<br />
450<br />
India Economic Policy Uncertainity Index relative to World (3MMA) (pushed forward 3M) on reverse scale -LS<br />
MSCI India YoY perf. Relative to ACWI<br />
2003<br />
2004<br />
2005<br />
2006<br />
2007<br />
2008<br />
2009<br />
2010<br />
2011<br />
2012<br />
2013<br />
2014<br />
2015<br />
2016<br />
2017<br />
2018<br />
Source: Economic policy uncertainty index, RIMES, MSCI, Morgan Stanley Research<br />
95%<br />
85%<br />
75%<br />
65%<br />
55%<br />
45%<br />
35%<br />
25%<br />
15%<br />
5%<br />
-5%<br />
-15%<br />
-25%<br />
-35%<br />
-45%<br />
The investment rate has now gone well below trend -<br />
reminiscent of the 2002-03. With the counter cyclical<br />
government capex already in place, capacity utilization and<br />
asset turn above average, and growth likely improving, a<br />
private capex cycle is in the offing post elections. This sets<br />
the stage for an improvement in corporate profit margins.<br />
Exhibit 8: Investment as % of GDP<br />
45%<br />
Investment(% of GDP) Linear (Investment(% of GDP))<br />
40%<br />
35%<br />
30%<br />
25%<br />
20%<br />
15%<br />
10%<br />
5%<br />
F1952<br />
F1955<br />
F1958<br />
F1961<br />
F1964<br />
F1967<br />
F1970<br />
F1973<br />
F1976<br />
F1979<br />
F1982<br />
F1985<br />
F1988<br />
F1991<br />
F1994<br />
F1997<br />
F2000<br />
F2003<br />
F2006<br />
F2009<br />
F2012<br />
F2015<br />
F2018<br />
Source: CEIC, Morgan Stanley Research<br />
Growth appears to have troughed led by benign inflation, a<br />
turn in government capex, recovery in consumption and<br />
exports, and the passage of one time shocks like GST and<br />
demonetization.<br />
As a consequence, credit growth, which put in a bottom last<br />
year, seems to be entering a new cycle. Indeed, the peak of<br />
previous cycle was way above history and thus the recent<br />
trough was well below history.<br />
Exhibit 9: Manufacturing PMI<br />
64<br />
62<br />
60<br />
58<br />
56<br />
54<br />
52<br />
50<br />
48<br />
46<br />
44<br />
HSBC India Manufacturing Purchasing Managers’ Index<br />
Jan-06<br />
Jul-06<br />
Jan-07<br />
Jul-07<br />
Jan-08<br />
Jul-08<br />
Jan-09<br />
Jul-09<br />
Jan-10<br />
Jul-10<br />
Jan-11<br />
Jul-11<br />
Jan-12<br />
Jul-12<br />
Jan-13<br />
Jul-13<br />
Jan-14<br />
Jul-14<br />
Jan-15<br />
Jul-15<br />
Jan-16<br />
Jul-16<br />
Jan-17<br />
Jul-17<br />
Jan-18<br />
Jul-18<br />
Source: Markit Economics, Morgan Stanley Research<br />
Exhibit 10: Trailing 3-year Bank credit growth<br />
36%<br />
32%<br />
28%<br />
24%<br />
20%<br />
16%<br />
12%<br />
8%<br />
4%<br />
Oct-91<br />
Oct-93<br />
Oct-95<br />
Oct-97<br />
Oct-99<br />
Oct-01<br />
Trailing 3-yr Credit Growth<br />
Oct-03<br />
Oct-05<br />
Oct-07<br />
Oct-09<br />
Oct-11<br />
Oct-13<br />
Oct-15<br />
Oct-17<br />
Source: RBI, Morgan Stanley Research<br />
4


