


You also want an ePaper? Increase the reach of your titles
YUMPU automatically turns print PDFs into web optimized ePapers that Google loves.
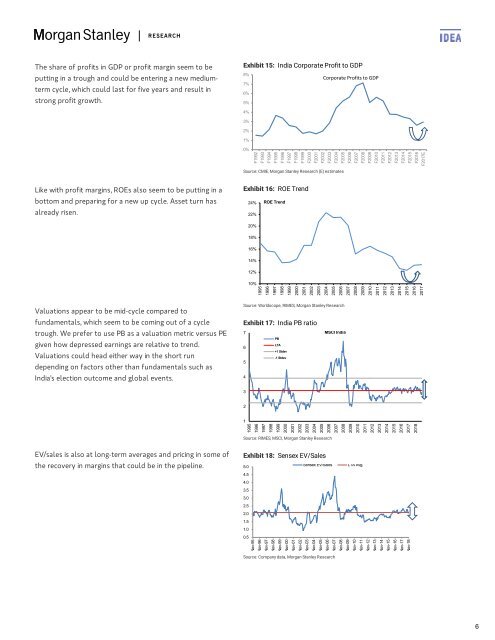
The share of profits in GDP or profit margin seem to be<br />
putting in a trough and could be entering a new mediumterm<br />
cycle, which could last for five years and result in<br />
strong profit growth.<br />
Exhibit 15: India Corporate Profit to GDP<br />
8%<br />
7%<br />
6%<br />
5%<br />
4%<br />
3%<br />
2%<br />
1%<br />
0%<br />
Corporate Profits to GDP<br />
F1992<br />
F1993<br />
F1994<br />
F1995<br />
F1996<br />
F1997<br />
F1998<br />
F1999<br />
F2000<br />
F2001<br />
F2002<br />
F2003<br />
F2004<br />
F2005<br />
F2006<br />
F2007<br />
F2008<br />
F2009<br />
F2010<br />
F2011<br />
F2012<br />
F2013<br />
F2014<br />
F2015<br />
F2016<br />
F2017E<br />
Source: CMIE, Morgan Stanley Research (E) estimates<br />
Like with profit margins, ROEs also seem to be putting in a<br />
bottom and preparing for a new up cycle. Asset turn has<br />
already risen.<br />
Exhibit 16: ROE Trend<br />
24% ROE Trend<br />
22%<br />
20%<br />
18%<br />
16%<br />
14%<br />
12%<br />
10%<br />
1995<br />
1996<br />
1997<br />
1998<br />
1999<br />
2000<br />
2001<br />
2002<br />
2003<br />
2004<br />
2005<br />
2006<br />
2007<br />
2008<br />
2009<br />
2010<br />
2011<br />
2012<br />
2013<br />
2014<br />
2015<br />
2016<br />
2017<br />
Valuations appear to be mid-cycle compared to<br />
fundamentals, which seem to be coming out of a cycle<br />
trough. We prefer to use PB as a valuation metric versus PE<br />
given how depressed earnings are relative to trend.<br />
Valuations could head either way in the short run<br />
depending on factors other than fundamentals such as<br />
India's election outcome and global events.<br />
Source: Worldscope, RIMES, Morgan Stanley Research<br />
Exhibit 17: India PB ratio<br />
7<br />
MSCI India<br />
PB<br />
LTA<br />
6<br />
+1 Stdev<br />
-1 Stdev<br />
5<br />
4<br />
3<br />
2<br />
1<br />
1995<br />
1996<br />
1997<br />
1998<br />
1999<br />
2000<br />
2001<br />
2002<br />
2003<br />
2004<br />
2005<br />
2006<br />
2007<br />
2008<br />
2009<br />
2010<br />
2011<br />
2012<br />
2013<br />
2014<br />
2015<br />
2016<br />
2017<br />
2018<br />
Source: RIMES, MSCI, Morgan Stanley Research<br />
EV/sales is also at long-term averages and pricing in some of<br />
the recovery in margins that could be in the pipeline.<br />
Exhibit 18: Sensex EV/Sales<br />
5.0<br />
4.5<br />
4.0<br />
3.5<br />
3.0<br />
2.5<br />
2.0<br />
1.5<br />
1.0<br />
0.5<br />
Sensex EV/Sales<br />
LTA Avg.<br />
Nov-95<br />
Nov-96<br />
Nov-97<br />
Nov-98<br />
Nov-99<br />
Nov-00<br />
Nov-01<br />
Nov-02<br />
Nov-03<br />
Nov-04<br />
Nov-05<br />
Nov-06<br />
Nov-07<br />
Nov-08<br />
Nov-09<br />
Nov-10<br />
Nov-11<br />
Nov-12<br />
Nov-13<br />
Nov-14<br />
Nov-15<br />
Nov-16<br />
Nov-17<br />
Nov-18<br />
Source: Company data, Morgan Stanley Research<br />
6


