Panalpina Annual Report 2011
Panalpina Annual Report 2011
Panalpina Annual Report 2011

Create successful ePaper yourself
Turn your PDF publications into a flip-book with our unique Google optimized e-Paper software.
98<br />
Consolidated Financial Statements <strong>2011</strong><br />
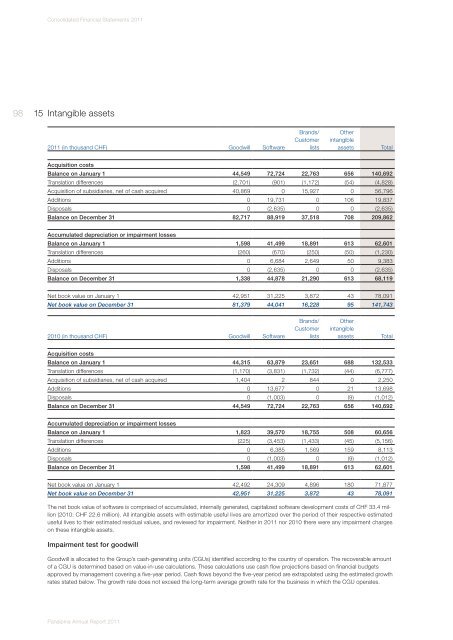
15<br />
Intangible assets<br />
<strong>2011</strong> (in thousand CHF)<br />
<strong>Panalpina</strong> <strong>Annual</strong> <strong>Report</strong> <strong>2011</strong><br />
Goodwill<br />
Software<br />
Brands/<br />
Customer<br />
lists<br />
Other<br />
intangible<br />
assets<br />
Acquisition costs<br />
Balance on January 1 44,549 72,724 22,763 656 140,692<br />
Translation differences (2,701) (901) (1,172) (54) (4,828)<br />
Acquisition of subsidiaries, net of cash acquired 40,869 0 15,927 0 56,796<br />
Additions 0 19,731 0 106 19,837<br />
Disposals 0 (2,635) 0 0 (2,635)<br />
Balance on December 31 82,717 88,919 37,518 708 209,862<br />
Accumulated depreciation or impairment losses<br />
Balance on January 1 1,598 41,499 18,891 613 62,601<br />
Translation differences (260) (670) (250) (50) (1,230)<br />
Additions 0 6,684 2,649 50 9,383<br />
Disposals 0 (2,635) 0 0 (2,635)<br />
Balance on December 31 1,338 44,878 21,290 613 68,119<br />
Net book value on January 1 42,951 31,225 3,872 43 78,091<br />
Net book value on December 31 81,379 44,041 16,228 95 141,743<br />
2010 (in thousand CHF)<br />
Goodwill<br />
Software<br />
Brands/<br />
Customer<br />
lists<br />
Other<br />
intangible<br />
assets<br />
Acquisition costs<br />
Balance on January 1 44,315 63,879 23,651 688 132,533<br />
Translation differences (1,170) (3,831) (1,732) (44) (6,777)<br />
Acquisition of subsidiaries, net of cash acquired 1,404 2 844 0 2,250<br />
Additions 0 13,677 0 21 13,698<br />
Disposals 0 (1,003) 0 (9) (1,012)<br />
Balance on December 31 44,549 72,724 22,763 656 140,692<br />
Accumulated depreciation or impairment losses<br />
Balance on January 1 1,823 39,570 18,755 508 60,656<br />
Translation differences (225) (3,453) (1,433) (45) (5,156)<br />
Additions 0 6,385 1,569 159 8,113<br />
Disposals 0 (1,003) 0 (9) (1,012)<br />
Balance on December 31 1,598 41,499 18,891 613 62,601<br />
Net book value on January 1 42,492 24,309 4,896 180 71,877<br />
Net book value on December 31 42,951 31,225 3,872 43 78,091<br />
The net book value of software is comprised of accumulated, internally generated, capitalized software development costs of CHF 33.4 million<br />
(2010: CHF 22.6 million). All intangible assets with estimable useful lives are amortized over the period of their respective estimated<br />
useful lives to their estimated residual values, and reviewed for impairment. Neither in <strong>2011</strong> nor 2010 there were any impairment charges<br />
on these intangible assets.<br />
Impairment test for goodwill<br />
Goodwill is allocated to the Group’s cash-generating units (CGUs) identified according to the country of operation. The recoverable amount<br />
of a CGU is determined based on value-in-use calculations. These calculations use cash flow projections based on financial budgets<br />
ap proved by management covering a five-year period. Cash flows beyond the five-year period are extrapolated using the estimated growth<br />
rates stated below. The growth rate does not exceed the long-term average growth rate for the business in which the CGU operates.<br />
Total<br />
Total