Panalpina Annual Report 2011
Panalpina Annual Report 2011
Panalpina Annual Report 2011

You also want an ePaper? Increase the reach of your titles
YUMPU automatically turns print PDFs into web optimized ePapers that Google loves.
12<br />
<strong>Report</strong> of the Executive Board<br />
Overall development<br />
EBITDA Operating expenses<br />
in million CHF<br />
<strong>2011</strong><br />
2010*<br />
212<br />
62<br />
<strong>Panalpina</strong> <strong>Annual</strong> <strong>Report</strong> <strong>2011</strong><br />
1,265<br />
1,418<br />
* Other operating expenses in 2010 included a charge of CHF 128 million which the<br />
Company recognized to cover all costs arising from the settlement of two legal<br />
claims in the United States and associated compliance consulting costs as well as<br />
from an internal reorganization project.<br />
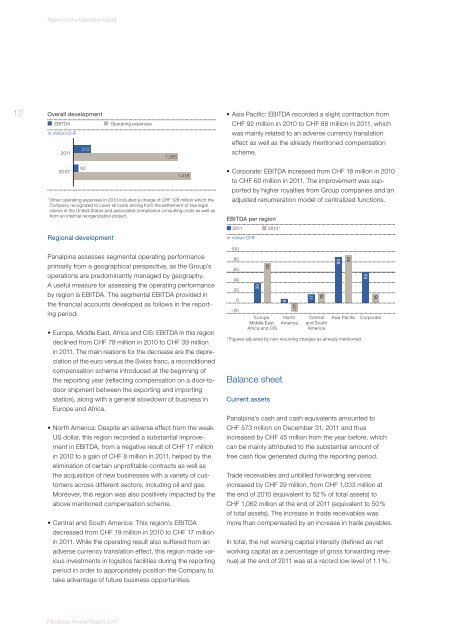
Regional development<br />
<strong>Panalpina</strong> assesses segmental operating performance<br />
primarily from a geographical perspective, as the Group’s<br />
operations are predominantly managed by geography.<br />
A useful measure for assessing the operating performance<br />
by region is EBITDA. The segmental EBITDA provided in<br />
the financial accounts developed as follows in the reporting<br />
period:<br />
�������������������������������������������������������������<br />
declined from CHF 78 million in 2010 to CHF 39 million<br />
in <strong>2011</strong>. The main reasons for the decrease are the depreciation<br />
of the euro versus the Swiss franc, a reconditioned<br />
compensation scheme introduced at the beginning of<br />
the reporting year (reflecting compensation on a door-todoor<br />
shipment between the exporting and importing<br />
station), along with a general slowdown of business in<br />
Europe and Africa.<br />
���������������������������������������������������������<br />
US dollar, this region recorded a substantial improvement<br />
in EBITDA, from a negative result of CHF 17 million<br />
in 2010 to a gain of CHF 8 million in <strong>2011</strong>, helped by the<br />
elimination of certain unprofitable contracts as well as<br />
the acquisition of new businesses with a variety of customers<br />
across different sectors, including oil and gas.<br />
Moreover, this region was also positively impacted by the<br />
above mentioned compensation scheme.<br />
��������������������������������������������������<br />
decreased from CHF 19 million in 2010 to CHF 17 million<br />
in <strong>2011</strong>. While the operating result also suffered from an<br />
adverse currency translation effect, this region made various<br />
investments in logistics facilities during the reporting<br />
period in order to appropriately position the Company to<br />
take advantage of future business opportunities.<br />
����������������������������������������������������������<br />
CHF 92 million in 2010 to CHF 88 million in <strong>2011</strong>, which<br />
was mainly related to an adverse currency translation<br />
effect as well as the already mentioned compensation<br />
scheme.<br />
����������������������������������������������������������<br />
to CHF 60 million in <strong>2011</strong>. The improvement was supported<br />
by higher royalties from Group companies and an<br />
adjusted renumeration model of centralized functions.<br />
EBITDA per region<br />
<strong>2011</strong> 2010*<br />
in million CHF<br />
100<br />
80<br />
60<br />
40<br />
20<br />
0<br />
–20<br />
39<br />
78<br />
Europe,<br />
Middle East,<br />
Africa and CIS<br />
8<br />
–17<br />
North<br />
America<br />
*Figures adjusted by non-recurring charges as already mentioned.<br />
Balance sheet<br />
Current assets<br />
17<br />
19<br />
Central<br />
and South<br />
America<br />
88<br />
92<br />
60<br />
18<br />
Asia Pacific Corporate<br />
<strong>Panalpina</strong>’s cash and cash equivalents amounted to<br />
CHF 573 million on December 31, <strong>2011</strong> and thus<br />
increased by CHF 45 million from the year before, which<br />
can be mainly attributed to the substantial amount of<br />
free cash flow generated during the reporting period.<br />
Trade receivables and unbilled forwarding services<br />
increased by CHF 29 million, from CHF 1,033 million at<br />
the end of 2010 (equivalent to 52 % of total assets) to<br />
CHF 1,062 million at the end of <strong>2011</strong> (equivalent to 50 %<br />
of total assets). The increase in trade receivables was<br />
more than compensated by an increase in trade payables.<br />
In total, the net working capital intensity (defined as net<br />
working capital as a percentage of gross forwarding revenue)<br />
at the end of <strong>2011</strong> was at a record low level of 1.1 %.