Panalpina Annual Report 2011
Panalpina Annual Report 2011
Panalpina Annual Report 2011

Create successful ePaper yourself
Turn your PDF publications into a flip-book with our unique Google optimized e-Paper software.
128<br />
Consolidated Financial Statements <strong>2011</strong><br />
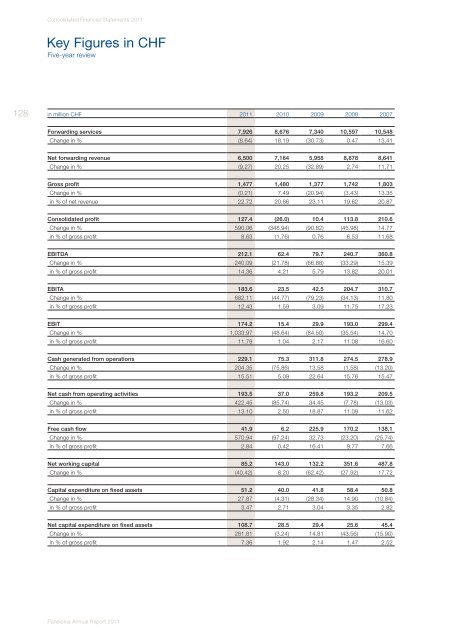
Key Figures in CHF<br />
Five-year review<br />
in million CHF <strong>2011</strong> 2010 2009 2008 2007<br />
Forwarding services 7,926 8,676 7,340 10,597 10,548<br />
Change in % (8.64) 18.19 (30.73) 0.47 13.41<br />
Net forwarding revenue 6,500 7,164 5,958 8,878 8,641<br />
Change in % (9.27) 20.25 (32.89) 2.74 11.71<br />
Gross profit 1,477 1,480 1,377 1,742 1,803<br />
Change in % (0.21) 7.49 (20.94) (3.43) 13.35<br />
in % of net revenue 22.72 20.66 23.11 19.62 20.87<br />
Consolidated profit 127.4 (26.0) 10.4 113.8 210.6<br />
Change in % 590.06 (348.94) (90.82) (45.98) 14.77<br />
in % of gross profit 8.63 (1.76) 0.76 6.53 11.68<br />
EBITDA 212.1 62.4 79.7 240.7 360.8<br />
Change in % 240.09 (21.78) (66.88) (33.29) 15.39<br />
in % of gross profit 14.36 4.21 5.79 13.82 20.01<br />
EBITA 183.6 23.5 42.5 204.7 310.7<br />
Change in % 682.11 (44.77) (79.23) (34.13) 11.80<br />
in % of gross profit 12.43 1.59 3.09 11.75 17.23<br />
EBIT 174.2 15.4 29.9 193.0 299.4<br />
Change in % 1,033.97 (48.64) (84.50) (35.54) 14.70<br />
in % of gross profit 11.79 1.04 2.17 11.08 16.60<br />
Cash generated from operations 229.1 75.3 311.8 274.5 278.9<br />
Change in % 204.35 (75.86) 13.58 (1.58) (13.20)<br />
in % of gross profit 15.51 5.09 22.64 15.76 15.47<br />
Net cash from operating activities 193.5 37.0 259.8 193.2 209.5<br />
Change in % 422.45 (85.74) 34.45 (7.78) (13.03)<br />
in % of gross profit 13.10 2.50 18.87 11.09 11.62<br />
Free cash flow 41.9 6.2 225.9 170.2 138.1<br />
Change in % 570.94 (97.24) 32.73 (23.20) (25.74)<br />
in % of gross profit 2.84 0.42 16.41 9.77 7.66<br />
Net working capital 85.2 143.0 132.2 351.6 487.8<br />
Change in % (40.42) 8.20 (62.42) (27.92) 17.72<br />
Capital expenditure on fixed assets 51.2 40.0 41.8 58.4 50.8<br />
Change in % 27.87 (4.31) (28.34) 14.90 (10.84)<br />
in % of gross profit 3.47 2.71 3.04 3.35 2.82<br />
Net capital expenditure on fixed assets 108.7 28.5 29.4 25.6 45.4<br />
Change in % 281.81 (3.24) 14.81 (43.56) (15.90)<br />
in % of gross profit 7.36 1.92 2.14 1.47 2.52<br />
<strong>Panalpina</strong> <strong>Annual</strong> <strong>Report</strong> <strong>2011</strong>