Panalpina Annual Report 2011
Panalpina Annual Report 2011
Panalpina Annual Report 2011

Create successful ePaper yourself
Turn your PDF publications into a flip-book with our unique Google optimized e-Paper software.
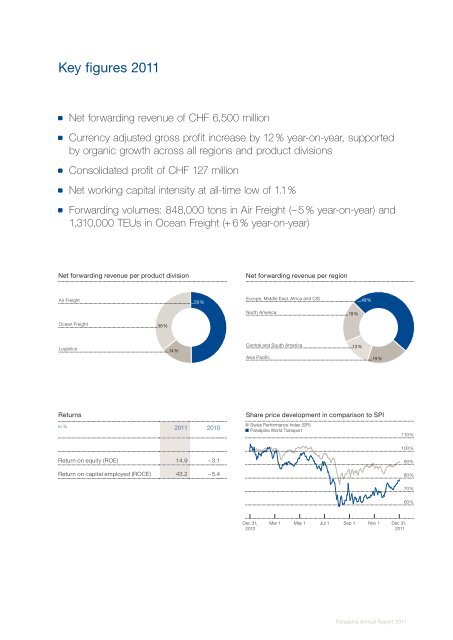
Key figures <strong>2011</strong><br />
Net forwarding revenue per product division<br />
Air Freight<br />
Ocean Freight<br />
Logistics<br />
Net forwarding revenue of CHF 6,500 million<br />
Currency adjusted gross profit increase by 12 % year-on-year, supported<br />
by organic growth across all regions and product divisions<br />
Consolidated profit of CHF 127 million<br />
Net working capital intensity at all-time low of 1.1 %<br />
Forwarding volumes: 848,000 tons in Air Freight (– 5 % year-on-year) and<br />
1,310,000 TEUs in Ocean Freight (+ 6 % year-on-year)<br />
Returns<br />
36%<br />
14%<br />
50%<br />
in % <strong>2011</strong> 2010<br />
Return on equity (ROE) 14.9 – 3.1<br />
Return on capital employed (ROCE) 43.2 – 5.4<br />
Net forwarding revenue per region<br />
Europe, Middle East, Africa and CIS<br />
North America<br />
Central and South America<br />
19%<br />
13%<br />
49%<br />
Asia Pacific 19%<br />
Share price development in comparison to SPI<br />
Swiss Performance Index (SPI)<br />
<strong>Panalpina</strong> World Transport<br />
Dec 31,<br />
2010<br />
Mar 1 May 1 Jul 1 Sep 1 Nov 1 Dec 31,<br />
<strong>2011</strong><br />
110%<br />
100%<br />
<strong>Panalpina</strong> <strong>Annual</strong> <strong>Report</strong> <strong>2011</strong><br />
90%<br />
80%<br />
70%<br />
60%