Panalpina Annual Report 2011
Panalpina Annual Report 2011
Panalpina Annual Report 2011

You also want an ePaper? Increase the reach of your titles
YUMPU automatically turns print PDFs into web optimized ePapers that Google loves.
102<br />
Consolidated Financial Statements <strong>2011</strong><br />
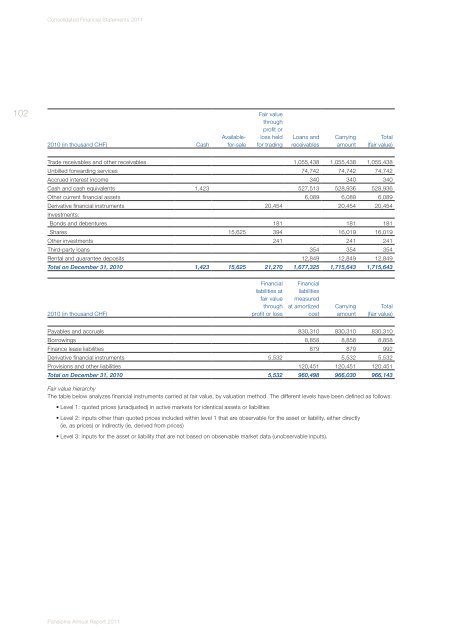
2010 (in thousand CHF)<br />
<strong>Panalpina</strong> <strong>Annual</strong> <strong>Report</strong> <strong>2011</strong><br />
Cash<br />
Available-<br />
for-sale<br />
Fair value<br />
through<br />
profit or<br />
loss held<br />
for trading<br />
Loans and<br />
receivables<br />
Carrying<br />
amount<br />
Total<br />
(fair value)<br />
Trade receivables and other receivables 1,055,438 1,055,438 1,055,438<br />
Unbilled forwarding services 74,742 74,742 74,742<br />
Accrued interest income 340 340 340<br />
Cash and cash equivalents 1,423 527,513 528,936 528,936<br />
Other current financial assets 6,089 6,089 6,089<br />
Derivative financial instruments<br />
Investments:<br />
20,454 20,454 20,454<br />
Bonds and debentures 181 181 181<br />
Shares 15,625 394 16,019 16,019<br />
Other investments 241 241 241<br />
Third-party loans 354 354 354<br />
Rental and guarantee deposits 12,849 12,849 12,849<br />
Total on December 31, 2010 1,423 15,625 21,270 1,677,325 1,715,643 1,715,643<br />
2010 (in thousand CHF)<br />
Financial<br />
liabilities at<br />
fair value<br />
through<br />
profit or loss<br />
Financial<br />
liabilities<br />
measured<br />
at amortized<br />
cost<br />
Carrying<br />
amount<br />
Total<br />
(fair value)<br />
Payables and accruals 830,310 830,310 830,310<br />
Borrowings 8,858 8,858 8,858<br />
Finance lease liabilities 879 879 992<br />
Derivative financial instruments 5,532 5,532 5,532<br />
Provisions and other liabilities 120,451 120,451 120,451<br />
Total on December 31, 2010 5,532 960,498 966,030 966,143<br />
Fair value hierarchy<br />
The table below analyzes financial instruments carried at fair value, by valuation method. The different levels have been defined as follows:<br />
• Level 1: quoted prices (unadjusted) in active markets for identical assets or liabilities<br />
• Level 2: inputs other than quoted prices included within level 1 that are observable for the asset or liability, either directly<br />
(ie, as prices) or indirectly (ie, derived from prices)<br />
• Level 3: inputs for the asset or liability that are not based on observable market data (unobservable inputs).