Panalpina Annual Report 2011
Panalpina Annual Report 2011
Panalpina Annual Report 2011

You also want an ePaper? Increase the reach of your titles
YUMPU automatically turns print PDFs into web optimized ePapers that Google loves.
10<br />
<strong>Report</strong> of the Executive Board<br />
in distinctly higher fuel and bunker surcharges (essentially<br />
also items with a pass-through character) which the Group<br />
invoiced to its customers.<br />
Influenced by these developments and coupled with lower<br />
volumes, but improved pricing discipline per file handled,<br />
as described in the preceding paragraph, the Group’s NFR<br />
generated with Air Freight decreased by 6 % to CHF 3,281<br />
million. In the Ocean Freight division, NFR saw the biggest<br />
impact from falling freight rates and decreased by 17 % to<br />
CHF 2,313 million, despite an expansion of volumes. In the<br />
third product division, Logistics, NFR saw an increase of<br />
2 % to CHF 906 million, which was driven by an expansion<br />
of business activities particularly in distribution, valueadded<br />
logistics services as well as overland.<br />
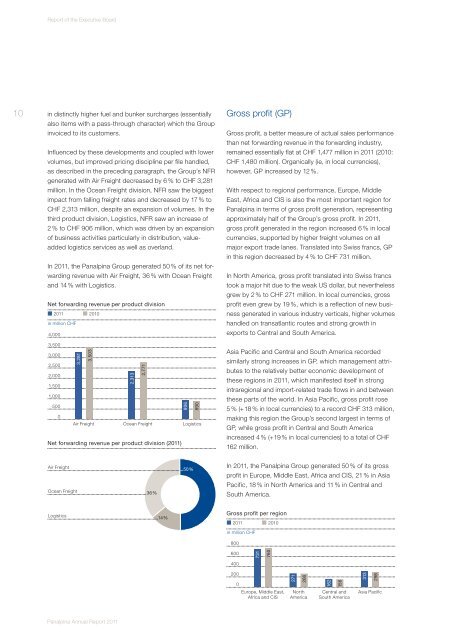
In <strong>2011</strong>, the <strong>Panalpina</strong> Group generated 50 % of its net forwarding<br />
revenue with Air Freight, 36 % with Ocean Freight<br />
and 14 % with Logistics.<br />
Net forwarding revenue per product division<br />
<strong>2011</strong> 2010<br />
in million CHF<br />
4,000<br />
3,500<br />
3,000<br />
2,500<br />
2,000<br />
1,500<br />
1,000<br />
500<br />
0<br />
Air Freight<br />
Ocean Freight<br />
Logistics<br />
3,281<br />
3,503<br />
Air Freight Ocean Freight Logistics<br />
Net forwarding revenue per product division (<strong>2011</strong>)<br />
<strong>Panalpina</strong> <strong>Annual</strong> <strong>Report</strong> <strong>2011</strong><br />
2,313<br />
2,771<br />
36%<br />
14%<br />
906<br />
50%<br />
890<br />
Gross profit (GP)<br />
Gross profit, a better measure of actual sales performance<br />
than net forwarding revenue in the forwarding industry,<br />
remained essentially flat at CHF 1,477 million in <strong>2011</strong> (2010:<br />
CHF 1,480 million). Organically (ie, in local currencies),<br />
however, GP increased by 12 %.<br />
With respect to regional performance, Europe, Middle<br />
East, Africa and CIS is also the most important region for<br />
<strong>Panalpina</strong> in terms of gross profit generation, representing<br />
approximately half of the Group’s gross profit. In <strong>2011</strong>,<br />
gross profit generated in the region increased 6 % in local<br />
currencies, supported by higher freight volumes on all<br />
major export trade lanes. Translated into Swiss francs, GP<br />
in this region decreased by 4 % to CHF 731 million.<br />
In North America, gross profit translated into Swiss francs<br />
took a major hit due to the weak US dollar, but nevertheless<br />
grew by 2 % to CHF 271 million. In local currencies, gross<br />
profit even grew by 19 %, which is a reflection of new business<br />
generated in various industry verticals, higher volumes<br />
handled on transatlantic routes and strong growth in<br />
exports to Central and South America.<br />
Asia Pacific and Central and South America recorded<br />
similarly strong increases in GP, which management attributes<br />
to the relatively better economic development of<br />
these regions in <strong>2011</strong>, which manifested itself in strong<br />
intraregional and import-related trade flows in and between<br />
these parts of the world. In Asia Pacific, gross profit rose<br />
5 % (+ 18 % in local currencies) to a record CHF 313 million,<br />
making this region the Group’s second largest in terms of<br />
GP, while gross profit in Central and South America<br />
increased 4 % (+ 19 % in local currencies) to a total of CHF<br />
162 million.<br />
In <strong>2011</strong>, the <strong>Panalpina</strong> Group generated 50 % of its gross<br />
profit in Europe, Middle East, Africa and CIS, 21 % in Asia<br />
Pacific, 18 % in North America and 11 % in Central and<br />
South America.<br />
Gross profit per region<br />
<strong>2011</strong> 2010<br />
in million CHF<br />
800<br />
600<br />
400<br />
200<br />
0<br />
731<br />
760<br />
Europe, Middle East,<br />
Africa and CIS<br />
271<br />
266<br />
North<br />
America<br />
162<br />
156<br />
Central and<br />
South America<br />
313<br />
298<br />
Asia Pacific