- Page 1 and 2: DESIGN, ASSEMBLY AND CHARACTERIZATI
- Page 3 and 4: ACKNOWLEDGEMENTS First and foremost
- Page 5 and 6: CHAPTER 5 BARIUM TITANATE NICKEL CO
- Page 7 and 8: Table 6.1 Formulations of aqueous c
- Page 9: Figure 2.12 Schematic illustrations
- Page 13 and 14: Figure 4.9 Sintered nickel lattices
- Page 15 and 16: Figure 6.12 Optical image of the cr
- Page 17 and 18: 1.1. Motivation CHAPTER 1 INTRODUCT
- Page 19 and 20: and characterizing rheological prop
- Page 21 and 22: 2.1. Materials System CHAPTER 2 BAC
- Page 23 and 24: 2.2. Reentrant Structures and Ceram
- Page 25 and 26: devices would provide self-sustaini
- Page 27 and 28: a) b) Figure 2.4 Schematic illustra
- Page 29 and 30: production of concept models, injec
- Page 31 and 32: Fused Deposition Modeling (FDM) was
- Page 33 and 34: Laser Engineered Net Shaping (LENS)
- Page 35 and 36: Inkjet printing (IP) 27 is based on
- Page 37 and 38: Table 2.1 Comparisons of various SF
- Page 39 and 40: Figure 2.11 Processing steps involv
- Page 41 and 42: 2.4.1 Colloidal Inks The printing i
- Page 43 and 44: Robocasting has lacked a well-desig
- Page 45 and 46: Table 2.2 Example polymers that dep
- Page 47 and 48: 2.6. Sintering In robocasting, sint
- Page 49 and 50: Figure 2.15 Sphere and plate model
- Page 51 and 52: where
- Page 53 and 54: 2.5.3 Solid State Sintering In this
- Page 55 and 56: Figure 2.18 Illustration of neck gr
- Page 57 and 58: 2.5.3.4 Final Stage During this sta
- Page 59 and 60: Figure 2.23 Schematic diagram of th
- Page 61 and 62:
2.5.4.2 Rearrangement With the form
- Page 63 and 64:
2.5.4.6 Spreading of Sintering Aid
- Page 65 and 66:
Driven by reduction of free energy,
- Page 67 and 68:
2.5.5 Sintering Atmosphere Sinterin
- Page 69 and 70:
2.7. Composite Materials In this re
- Page 71 and 72:
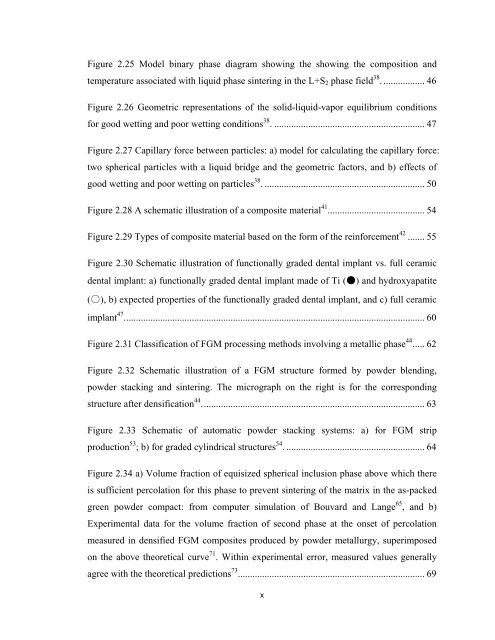
Figure 2.29 Types of composite mate
- Page 73 and 74:
Table 2.6 Examples of composite mat
- Page 75 and 76:
Table 2.7 Examples of FGM applicati
- Page 77 and 78:
2.7.3 Processing For the fabricatio
- Page 79 and 80:
prepared discrete layers of uniform
- Page 81 and 82:
Powder densification processes gene
- Page 83 and 84:
The specific volume fraction beyond
- Page 85 and 86:
a) b) Figure 2.34 a) Volume fractio
- Page 87 and 88:
When the powders are densified in s
- Page 89 and 90:
Various FGM coating processes are a
- Page 91 and 92:
of FGMs, such as partially reactive
- Page 93 and 94:
leading to a characteristic time τ
- Page 95 and 96:
3.1 Introduction CHAPTER 3 AQUEOUS
- Page 97 and 98:
occurs in a multi-step process: fir
- Page 99 and 100:
a) b) Figure 3.1 a) SEM image of as
- Page 101 and 102:
3.2.3 Preparation of Carbon Black C
- Page 103 and 104:
3.2.5 Drying Shrinkage Characteriza
- Page 105 and 106:
the optimized surfactant concentrat
- Page 107 and 108:
The storage modulus of a colloidal
- Page 109 and 110:
For HA ink, yield stress
- Page 111 and 112:
In the case of the aqueous carbon b
- Page 113 and 114:
PPO units of Pluronic F-127 may ads
- Page 115 and 116:
a) b) Figure 3.6 A carbon black lat
- Page 117 and 118:
a) b) Figure 3.7 SEM images of a) c
- Page 119 and 120:
TGA plot is in agreement with previ
- Page 121 and 122:
a) b) Figure 3.9 Thermogravimetric
- Page 123 and 124:
3.3.8 Fabrication of Complex Cerami
- Page 125 and 126:
c) d) 109
- Page 127 and 128:
3.4 Conclusion A fugitive support m
- Page 129 and 130:
metal inks have been reported for R
- Page 131 and 132:
Midland, MI) 5% by weight stock sol
- Page 133 and 134:
4.2.5. Thermal Degradation of Binde
- Page 135 and 136:
4.3. Results and Discussion 4.3.1.
- Page 137 and 138:
4.3.2. Preparation of Nickel Ink Su
- Page 139 and 140:
260 °C for 8 hours, the residual c
- Page 141 and 142:
Table 4.1 Calculated residual carbo
- Page 143 and 144:
a) b) Figure 4.6 Sintered Ni struct
- Page 145 and 146:
temperature 138, 139 lead to 92-95%
- Page 147 and 148:
Figure 4.8 Scanning electron microg
- Page 149 and 150:
c) Figure 4.9 Sintered nickel latti
- Page 151 and 152:
5.1. Introduction CHAPTER 5 BARIUM
- Page 153 and 154:
materials within the overall struct
- Page 155 and 156:
40:60, 60:40, 80:20 are separately
- Page 157 and 158:
5.2.3. Rheological Characterization
- Page 159 and 160:
5.2.5. Co-sintering and Re-oxidatio
- Page 161 and 162:
mixing, BT and Ni phases appear uni
- Page 163 and 164:
The combined use of PAA and PAA-90K
- Page 165 and 166:
To quantify this difference in sint
- Page 167 and 168:
As the BT and Ni particles used in
- Page 169 and 170:
The reducing atmosphere used in the
- Page 171 and 172:
Figure 5.7 Vickers hardness number
- Page 173 and 174:
5.3.6. Fabrication of BT-Ni composi
- Page 175 and 176:
modify the sintering kinetics of th
- Page 177 and 178:
a) b) Figure 5.10 Co-sintered compo
- Page 179 and 180:
5.4. Conclusions Freeform fabricati
- Page 181 and 182:
Liquid phase sintering involves usi
- Page 183 and 184:
(pH=4.4, 31.5% by weight) (Adva Flo
- Page 185 and 186:
concentration of 7 mg/mL in the aqu
- Page 187 and 188:
Table 6.1 Formulations of aqueous c
- Page 189 and 190:
thickness. Each layer of the struct
- Page 191 and 192:
6.2.6. Hardness Test Microindentati
- Page 193 and 194:
micrographs for these two powders.
- Page 195 and 196:
Second, the added LiAC∙2H2O is am
- Page 197 and 198:
Figure 6.3 Oscillatory behavior for
- Page 199 and 200:
a) b) Figure 6.4 Sintering strain c
- Page 201 and 202:
mass transport in LFBT network. 167
- Page 203 and 204:
The above discussion is mainly focu
- Page 205 and 206:
Figure 6.8 shows the bowtie-shaped
- Page 207 and 208:
Figure 6.10 A NPR composite of para
- Page 209 and 210:
etween BT and Ni phases. But Zn ele
- Page 211 and 212:
Figure 6.13 Scanning electron micro
- Page 213 and 214:
Figure 6.15 shows the mapping of Ti
- Page 215 and 216:
Figure 6.17 and Figure 6.18 show el
- Page 217 and 218:
Figure 6.19 shows element mapping f
- Page 219 and 220:
6.3.7. Piezoelectricity and Dielect
- Page 221 and 222:
6.4. Conclusions Aqueous colloidal
- Page 223 and 224:
geometric features, including non-s
- Page 225 and 226:
3. Development of aqueous colloidal
- Page 227 and 228:
7.2. Recommendations In the context
- Page 229 and 230:
gelation behavior. κ-carrageenan i
- Page 231 and 232:
REFERENCES 1. Larsson 9301647, 1993
- Page 233 and 234:
29. Simchi, A.; Petzoldt, F.; Pohl,
- Page 235 and 236:
61. Bouvard, D., Acta Metallurgica
- Page 237 and 238:
92. Morissette, S. L.; Lewis, J. A.
- Page 239 and 240:
120. Boehm, H. P., Some Aspects of
- Page 241 and 242:
150. Atkinson, A., Growth of Nio an
- Page 243 and 244:
APPENDICES A. Mathematical Modeling
- Page 245 and 246:
and
- Page 247 and 248:
conditions: Equation A.12 is solved
- Page 249 and 250:
and with
- Page 251 and 252:
a) b) Figure B.1 a) Freeze-dried st
- Page 253 and 254:
a) Figure C.1 Cr-Ni lattices of 5Cr
- Page 255 and 256:
E. Binary Phase Diagram of ZnO-B2O3
- Page 257 and 258:
References A.1. Du, Z., Sarofim, A.
- Page 259:
Name: Jian Xu Date of Degree: May,


