- Page 1 and 2:
Introduction to Time Series and For
- Page 4:
This page intentionally left blank
- Page 8:
Peter J. Brockwell Richard A. Davis
- Page 12:
This page intentionally left blank
- Page 16:
viii Preface Since the upgrade to I
- Page 20:
x Contents 2.6. The Wold Decomposit
- Page 24:
xii Contents 8.8.2. Observation-Dri
- Page 28:
xiv Contents D.6. Model Properties
- Page 32:
2 Chapter 1 Introduction Figure 1-1
- Page 36:
4 Chapter 1 Introduction Figure 1-3
- Page 40:
6 Chapter 1 Introduction 3.5% of th
- Page 44:
8 Chapter 1 Introduction Example 1.
- Page 48:
10 Chapter 1 Introduction where mt
- Page 52:
12 Chapter 1 Introduction Figure 1-
- Page 56:
14 Chapter 1 Introduction n/12 6,
- Page 60:
16 Chapter 1 Introduction variable,
- Page 64:
18 Chapter 1 Introduction at once t
- Page 68:
20 Chapter 1 Introduction Example 1
- Page 72:
22 Chapter 1 Introduction ACF -0.2
- Page 76:
24 Chapter 1 Introduction Figure 1-
- Page 80:
26 Chapter 1 Introduction Figure 1-
- Page 84:
28 Chapter 1 Introduction can be co
- Page 88:
30 Chapter 1 Introduction If the op
- Page 92:
32 Chapter 1 Introduction The reest
- Page 96:
34 Chapter 1 Introduction Figure 1-
- Page 100:
36 Chapter 1 Introduction (a) The s
- Page 104:
38 Chapter 1 Introduction It can al
- Page 108:
40 Chapter 1 Introduction Problems
- Page 112:
42 Chapter 1 Introduction 1.8. Let
- Page 116:
44 Chapter 1 Introduction At this p
- Page 120:
46 Chapter 2 Stationary Processes T
- Page 124:
48 Chapter 2 Stationary Processes T
- Page 128:
50 Chapter 2 Stationary Processes i
- Page 132:
52 Chapter 2 Stationary Processes P
- Page 136:
54 Chapter 2 Stationary Processes I
- Page 140:
56 Chapter 2 Stationary Processes A
- Page 144:
58 Chapter 2 Stationary Processes 2
- Page 148:
60 Chapter 2 Stationary Processes w
- Page 152:
62 Chapter 2 Stationary Processes A
- Page 156:
64 Chapter 2 Stationary Processes I
- Page 160:
66 Chapter 2 Stationary Processes w
- Page 164:
68 Chapter 2 Stationary Processes P
- Page 168:
70 Chapter 2 Stationary Processes
- Page 172:
72 Chapter 2 Stationary Processes I
- Page 176:
74 Chapter 2 Stationary Processes a
- Page 180:
76 Chapter 2 Stationary Processes t
- Page 184:
78 Chapter 2 Stationary Processes P
- Page 188:
80 Chapter 2 Stationary Processes 2
- Page 192:
82 Chapter 2 Stationary Processes w
- Page 196:
84 Chapter 3 ARMA Models The proces
- Page 200:
86 Chapter 3 ARMA Models where θ0
- Page 204:
88 Chapter 3 ARMA Models The AR pol
- Page 208:
90 Chapter 3 ARMA Models moving ave
- Page 212:
92 Chapter 3 ARMA Models ACF -0.2 0
- Page 216:
94 Chapter 3 ARMA Models can be fou
- Page 220:
96 Chapter 3 ARMA Models Example 3.
- Page 224:
98 Chapter 3 ARMA Models is entirel
- Page 228:
100 Chapter 3 ARMA Models 3.3 Forec
- Page 232:
102 Chapter 3 ARMA Models and rn
- Page 236:
104 Chapter 3 ARMA Models and 2 E
- Page 240:
106 Chapter 3 ARMA Models where the
- Page 244:
108 Chapter 3 ARMA Models Problems
- Page 248:
110 Chapter 3 ARMA Models 3.10. By
- Page 252:
112 Chapter 4 Spectral Analysis 4.1
- Page 256:
114 Chapter 4 Spectral Analysis (ii
- Page 260:
116 Chapter 4 Spectral Analysis Not
- Page 264:
118 Chapter 4 Spectral Analysis Exa
- Page 268:
120 Chapter 4 Spectral Analysis Fig
- Page 272:
122 Chapter 4 Spectral Analysis Fig
- Page 276:
124 Chapter 4 Spectral Analysis The
- Page 280:
126 Chapter 4 Spectral Analysis fac
- Page 284:
128 Chapter 4 Spectral Analysis Fig
- Page 288:
130 Chapter 4 Spectral Analysis Sin
- Page 292:
132 Chapter 4 Spectral Analysis Fig
- Page 296:
134 Chapter 4 Spectral Analysis Pro
- Page 300:
136 Chapter 4 Spectral Analysis 4.9
- Page 304:
138 Chapter 5 Modeling and Forecast
- Page 308:
140 Chapter 5 Modeling and Forecast
- Page 312:
142 Chapter 5 Modeling and Forecast
- Page 316:
144 Chapter 5 Modeling and Forecast
- Page 320:
146 Chapter 5 Modeling and Forecast
- Page 324:
148 Chapter 5 Modeling and Forecast
- Page 328:
150 Chapter 5 Modeling and Forecast
- Page 332:
152 Chapter 5 Modeling and Forecast
- Page 336:
154 Chapter 5 Modeling and Forecast
- Page 340:
156 Chapter 5 Modeling and Forecast
- Page 344:
158 Chapter 5 Modeling and Forecast
- Page 348:
160 Chapter 5 Modeling and Forecast
- Page 352:
162 Chapter 5 Modeling and Forecast
- Page 356:
164 Chapter 5 Modeling and Forecast
- Page 360:
166 Chapter 5 Modeling and Forecast
- Page 364:
168 Chapter 5 Modeling and Forecast
- Page 368:
170 Chapter 5 Modeling and Forecast
- Page 372:
172 Chapter 5 Modeling and Forecast
- Page 376:
174 Chapter 5 Modeling and Forecast
- Page 380:
176 Chapter 5 Modeling and Forecast
- Page 384:
This page intentionally left blank
- Page 388:
180 Chapter 6 Nonstationary and Sea
- Page 392:
182 Chapter 6 Nonstationary and Sea
- Page 396:
184 Chapter 6 Nonstationary and Sea
- Page 400:
186 Chapter 6 Nonstationary and Sea
- Page 404:
188 Chapter 6 Nonstationary and Sea
- Page 408:
190 Chapter 6 Nonstationary and Sea
- Page 412:
192 Chapter 6 Nonstationary and Sea
- Page 416:
194 Chapter 6 Nonstationary and Sea
- Page 420:
196 Chapter 6 Nonstationary and Sea
- Page 424:
198 Chapter 6 Nonstationary and Sea
- Page 428:
200 Chapter 6 Nonstationary and Sea
- Page 432:
202 Chapter 6 Nonstationary and Sea
- Page 436:
204 Chapter 6 Nonstationary and Sea
- Page 440:
206 Chapter 6 Nonstationary and Sea
- Page 444:
208 Chapter 6 Nonstationary and Sea
- Page 448:
210 Chapter 6 Nonstationary and Sea
- Page 452:
212 Chapter 6 Nonstationary and Sea
- Page 456:
214 Chapter 6 Nonstationary and Sea
- Page 460:
216 Chapter 6 Nonstationary and Sea
- Page 464:
218 Chapter 6 Nonstationary and Sea
- Page 468:
220 Chapter 6 Nonstationary and Sea
- Page 472:
This page intentionally left blank
- Page 476:
224 Chapter 7 Multivariate Time Ser
- Page 480:
226 Chapter 7 Multivariate Time Ser
- Page 484:
228 Chapter 7 Multivariate Time Ser
- Page 488:
230 Chapter 7 Multivariate Time Ser
- Page 492:
232 Chapter 7 Multivariate Time Ser
- Page 496:
234 Chapter 7 Multivariate Time Ser
- Page 500:
236 Chapter 7 Multivariate Time Ser
- Page 504:
238 Chapter 7 Multivariate Time Ser
- Page 508:
240 Chapter 7 Multivariate Time Ser
- Page 512:
242 Chapter 7 Multivariate Time Ser
- Page 516:
244 Chapter 7 Multivariate Time Ser
- Page 520:
246 Chapter 7 Multivariate Time Ser
- Page 524:
248 Chapter 7 Multivariate Time Ser
- Page 528:
250 Chapter 7 Multivariate Time Ser
- Page 532:
252 Chapter 7 Multivariate Time Ser
- Page 536:
254 Chapter 7 Multivariate Time Ser
- Page 540:
256 Chapter 7 Multivariate Time Ser
- Page 544:
This page intentionally left blank
- Page 548:
260 Chapter 8 State-Space Models li
- Page 552:
262 Chapter 8 State-Space Models In
- Page 556:
264 Chapter 8 State-Space Models Fi
- Page 560:
266 Chapter 8 State-Space Models To
- Page 564:
268 Chapter 8 State-Space Models wh
- Page 568:
270 Chapter 8 State-Space Models if
- Page 572:
272 Chapter 8 State-Space Models De
- Page 576:
274 Chapter 8 State-Space Models Wi
- Page 580:
276 Chapter 8 State-Space Models wh
- Page 584:
278 Chapter 8 State-Space Models Th
- Page 588:
280 Chapter 8 State-Space Models so
- Page 592:
282 Chapter 8 State-Space Models Fi
- Page 596:
284 Chapter 8 State-Space Models Th
- Page 600:
286 Chapter 8 State-Space Models an
- Page 604:
288 Chapter 8 State-Space Models We
- Page 608:
290 Chapter 8 State-Space Models Th
- Page 612:
292 Chapter 8 State-Space Models Ta
- Page 616:
294 Chapter 8 State-Space Models Th
- Page 620:
296 Chapter 8 State-Space Models wi
- Page 624:
298 Chapter 8 State-Space Models Fi
- Page 628:
300 Chapter 8 State-Space Models Fi
- Page 632:
302 Chapter 8 State-Space Models is
- Page 636:
304 Chapter 8 State-Space Models As
- Page 640:
306 Chapter 8 State-Space Models ma
- Page 644:
308 Chapter 8 State-Space Models Ta
- Page 648:
310 Chapter 8 State-Space Models Fi
- Page 652:
312 Chapter 8 State-Space Models b.
- Page 656:
314 Chapter 8 State-Space Models an
- Page 660:
316 Chapter 8 State-Space Models a.
- Page 664:
318 Chapter 9 Forecasting Technique
- Page 668:
320 Chapter 9 Forecasting Technique
- Page 672:
322 Chapter 9 Forecasting Technique
- Page 676:
324 Chapter 9 Forecasting Technique
- Page 680:
326 Chapter 9 Forecasting Technique
- Page 684:
328 Chapter 9 Forecasting Technique
- Page 688:
330 Chapter 9 Forecasting Technique
- Page 692:
332 Chapter 10 Further Topics are,
- Page 696:
334 Chapter 10 Further Topics be th
- Page 700:
336 Chapter 10 Further Topics Figur
- Page 704:
338 Chapter 10 Further Topics Notin
- Page 708:
340 Chapter 10 Further Topics 10.2
- Page 712:
342 Chapter 10 Further Topics Figur
- Page 716:
344 Chapter 10 Further Topics Figur
- Page 720:
346 Chapter 10 Further Topics Figur
- Page 724:
348 Chapter 10 Further Topics cumul
- Page 728:
350 Chapter 10 Further Topics Since
- Page 732:
352 Chapter 10 Further Topics Figur
- Page 736:
354 Chapter 10 Further Topics Figur
- Page 740:
356 Chapter 10 Further Topics value
- Page 744:
358 Chapter 10 Further Topics Chung
- Page 748:
360 Chapter 10 Further Topics and w
- Page 752:
362 Chapter 10 Further Topics where
- Page 756:
364 Chapter 10 Further Topics Figur
- Page 760:
366 Chapter 10 Further Topics 10.2.
- Page 764:
This page intentionally left blank
- Page 768:
370 Appendix A Random Variables and
- Page 772:
372 Appendix A Random Variables and
- Page 776:
374 Appendix A Random Variables and
- Page 780:
376 Appendix A Random Variables and
- Page 784: 378 Appendix A Random Variables and
- Page 788: 380 Appendix A Random Variables and
- Page 792: This page intentionally left blank
- Page 796: 384 Appendix B Statistical Compleme
- Page 800: 386 Appendix B Statistical Compleme
- Page 804: 388 Appendix B Statistical Compleme
- Page 808: 390 Appendix B Statistical Compleme
- Page 812: This page intentionally left blank
- Page 816: 394 Appendix C Mean Square Converge
- Page 820: 396 Appendix D An ITSM Tutorial D.1
- Page 824: 398 Appendix D An ITSM Tutorial OK,
- Page 828: 400 Appendix D An ITSM Tutorial Fig
- Page 832: 402 Appendix D An ITSM Tutorial Exa
- Page 838: Figure D-4 The sample ACF of the tr
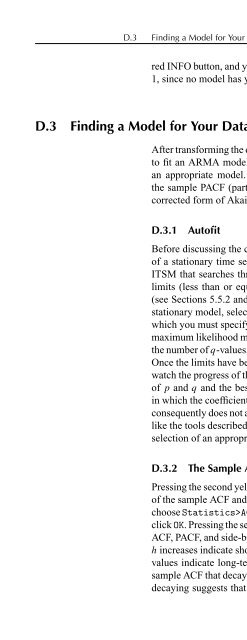
- Page 842: D.3 Finding a Model for Your Data 4
- Page 846: D.3 Finding a Model for Your Data 4
- Page 850: D.4 Testing Your Model D.4 Testing
- Page 854: D.4 Testing Your Model 413 frequenc
- Page 858: D.5 Prediction D.5 Prediction 415 t
- Page 862: D.6 Model Properties 417 of differe
- Page 866: Figure D-12 The PACF of the model i
- Page 870: D.7 Multivariate Time Series 421 us
- Page 874: References Akaike, H. (1969), Fitti
- Page 878: References 425 Dempster, A.P., Lair
- Page 882: References 427 Mood, A.M., Graybill
- Page 886:
A accidental deaths (DEATHS.TSM), 3
- Page 890:
estimation of missing values in an
- Page 894:
polynomial fitting, 28 population o