- Page 1 and 2:
Introduction to Time Series and For
- Page 4:
This page intentionally left blank
- Page 8:
Peter J. Brockwell Richard A. Davis
- Page 12:
This page intentionally left blank
- Page 16:
viii Preface Since the upgrade to I
- Page 20:
x Contents 2.6. The Wold Decomposit
- Page 24:
xii Contents 8.8.2. Observation-Dri
- Page 28:
xiv Contents D.6. Model Properties
- Page 32:
2 Chapter 1 Introduction Figure 1-1
- Page 36:
4 Chapter 1 Introduction Figure 1-3
- Page 40:
6 Chapter 1 Introduction 3.5% of th
- Page 44: 8 Chapter 1 Introduction Example 1.
- Page 48: 10 Chapter 1 Introduction where mt
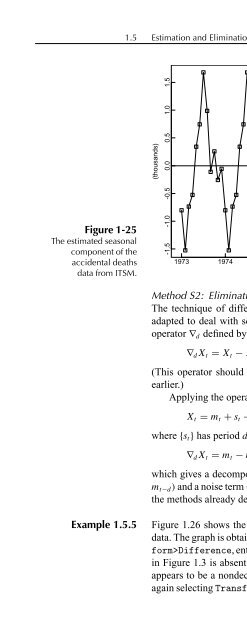
- Page 52: 12 Chapter 1 Introduction Figure 1-
- Page 56: 14 Chapter 1 Introduction n/12 6,
- Page 60: 16 Chapter 1 Introduction variable,
- Page 64: 18 Chapter 1 Introduction at once t
- Page 68: 20 Chapter 1 Introduction Example 1
- Page 72: 22 Chapter 1 Introduction ACF -0.2
- Page 76: 24 Chapter 1 Introduction Figure 1-
- Page 80: 26 Chapter 1 Introduction Figure 1-
- Page 84: 28 Chapter 1 Introduction can be co
- Page 88: 30 Chapter 1 Introduction If the op
- Page 92: 32 Chapter 1 Introduction The reest
- Page 98: 1.6 Testing the Estimated Noise Seq
- Page 102: 1.6 Testing the Estimated Noise Seq
- Page 106: Figure 1-28 The sample autocorrelat
- Page 110: Problems 41 d. Under the conditions
- Page 114: Problems 43 1.13. Find a filter of
- Page 118: 2 Stationary 2.1 Basic Properties P
- Page 122: 2.1 Basic Properties 47 with corres
- Page 126: 2.1 Basic Properties 49 and σ 2 θ
- Page 130: 2.2 Linear Processes 2.2 Linear Pro
- Page 134: 2.2 Linear Processes 53 where ψj
- Page 138: 2.3 Introduction to ARMA Processes
- Page 142: 2.4 Properties of the Sample Mean a
- Page 146:
2.4 Properties of the Sample Mean a
- Page 150:
2.4 Properties of the Sample Mean a
- Page 154:
Figure 2-2 The sample autocorrelati
- Page 158:
2.5 Forecasting Stationary Time Ser
- Page 162:
2.5 Forecasting Stationary Time Ser
- Page 166:
2.5 Forecasting Stationary Time Ser
- Page 170:
2.5 Forecasting Stationary Time Ser
- Page 174:
2.5 Forecasting Stationary Time Ser
- Page 178:
2.5 Forecasting Stationary Time Ser
- Page 182:
2.6 The Wold Decomposition 77 Apply
- Page 186:
Problems 79 functions are also auto
- Page 190:
Problems 81 2.15. Suppose that {Xt,
- Page 194:
3 ARMA 3.1 ARMA(p, q) Processes Mod
- Page 198:
3.1 ARMA(p, q) Processes 85 Existen
- Page 202:
3.1 ARMA(p, q) Processes 87 {πj} g
- Page 206:
3.2 The ACF and PACF of an ARMA(p,
- Page 210:
3.2 The ACF and PACF of an ARMA(p,
- Page 214:
Figure 3-3 The model ACF of the AR(
- Page 218:
3.2 The ACF and PACF of an ARMA(p,
- Page 222:
Figure 3-5 Time series of the overs
- Page 226:
3.2 The ACF and PACF of an ARMA(p,
- Page 230:
3.3 Forecasting ARMA Processes 101
- Page 234:
3.3 Forecasting ARMA Processes 103
- Page 238:
3.3 Forecasting ARMA Processes 105
- Page 242:
3.3 Forecasting ARMA Processes 107
- Page 246:
Problems 109 3.6. Show that the two
- Page 250:
4 Spectral Analysis 4.1 Spectral De
- Page 254:
4.1 Spectral Densities 113 1 2πN
- Page 258:
4.1 Spectral Densities 115 κ is an
- Page 262:
Figure 4-1 A sample path of size 10
- Page 266:
4.1 Spectral Densities 119 where {Z
- Page 270:
4.2 The Periodogram 121 ACF -0.5 0.
- Page 274:
4.2 The Periodogram 123 Now e1,...,
- Page 278:
4.2 The Periodogram 125 estimates i
- Page 282:
4.3 Time-Invariant Linear Filters 1
- Page 286:
4.3 Time-Invariant Linear Filters 1
- Page 290:
Figure 4-12 The transfer function D
- Page 294:
4.4 The Spectral Density of an ARMA
- Page 298:
Problems 135 4.5. If {Xt} and {Yt}
- Page 302:
5 Modeling and Forecasting with ARM
- Page 306:
5.1 Preliminary Estimation 139 of t
- Page 310:
5.1 Preliminary Estimation 141 Larg
- Page 314:
5.1 Preliminary Estimation 143 larg
- Page 318:
5.1 Preliminary Estimation 145 PACF
- Page 322:
5.1 Preliminary Estimation 147 Whil
- Page 326:
5.1 Preliminary Estimation 149 Exam
- Page 330:
5.1 Preliminary Estimation 151 Defi
- Page 334:
5.1 Preliminary Estimation 153 Rema
- Page 338:
5.1 Preliminary Estimation 155 Havi
- Page 342:
5.1 Preliminary Estimation 157 with
- Page 346:
5.2 Maximum Likelihood Estimation 1
- Page 350:
5.2 Maximum Likelihood Estimation 1
- Page 354:
5.2 Maximum Likelihood Estimation 1
- Page 358:
Figure 5-5 The rescaled residuals a
- Page 362:
5.4 Forecasting 5.4 Forecasting 167
- Page 366:
5.5 Order Selection 5.5 Order Selec
- Page 370:
5.5 Order Selection 171 Table 5.2
- Page 374:
5.5 Order Selection 173 It can be s
- Page 378:
Problems 175 for the mean-corrected
- Page 382:
Problems 177 that the mean is known
- Page 386:
6 Nonstationary and Seasonal Time S
- Page 390:
6.1 ARIMA Models for Nonstationary
- Page 394:
Figure 6-4 199 observations of the
- Page 398:
Figure 6-7 200 observations of the
- Page 402:
6.2 Identification Techniques 187 6
- Page 406:
Figure 6-11 The Australian red wine
- Page 410:
6.2 Identification Techniques 191 P
- Page 414:
6.3 Unit Roots in Time Series Model
- Page 418:
6.3 Unit Roots in Time Series Model
- Page 422:
6.3 Unit Roots in Time Series Model
- Page 426:
6.4 Forecasting ARIMA Models 199 of
- Page 430:
6.4 Forecasting ARIMA Models 201 wh
- Page 434:
6.5 Seasonal ARIMA Models 203 6.5 S
- Page 438:
Figure 6-15 The ACF of the model 6.
- Page 442:
6.5 Seasonal ARIMA Models 207 ACF -
- Page 446:
6.5 Seasonal ARIMA Models 209 and s
- Page 450:
6.6 Regression with ARMA Errors 211
- Page 454:
6.6 Regression with ARMA Errors 213
- Page 458:
6.6 Regression with ARMA Errors 215
- Page 462:
6.6 Regression with ARMA Errors 217
- Page 466:
Problems Figure 6-19 The difference
- Page 470:
Problems 221 6.9. Repeat Problem 6.
- Page 474:
7 Multivariate Time Series 7.1 Exam
- Page 478:
7.1 Examples 225 and a natural esti
- Page 482:
Figure 7-3 The sample ACF ˆρ22 of
- Page 486:
Figure 7-6 The sample correlations
- Page 490:
7.2 Second-Order Properties of Mult
- Page 494:
7.2 Second-Order Properties of Mult
- Page 498:
7.3 Estimation of the Mean and Cova
- Page 502:
7.3 Estimation of the Mean and Cova
- Page 506:
Figure 7-7 The sample correlations
- Page 510:
7.4 Multivariate ARMA Processes 241
- Page 514:
7.4 Multivariate ARMA Processes 243
- Page 518:
7.5 Best Linear Predictors of Secon
- Page 522:
7.6 Modeling and Forecasting with M
- Page 526:
7.6 Modeling and Forecasting with M
- Page 530:
7.6 Modeling and Forecasting with M
- Page 534:
7.6 Modeling and Forecasting with M
- Page 538:
7.7 Cointegration 255 Example 7.7.1
- Page 542:
Problems 257 and derive the error c
- Page 546:
8 State-Space Models 8.1 State-Spac
- Page 550:
8.1 State-Space Representations 261
- Page 554:
8.2 The Basic Structural Model 263
- Page 558:
Figure 8-2 Sample ACF of the series
- Page 562:
8.3 State-Space Representation of A
- Page 566:
8.3 State-Space Representation of A
- Page 570:
8.4 The Kalman Recursions 271 the v
- Page 574:
8.4 The Kalman Recursions 273 Kalma
- Page 578:
8.4 The Kalman Recursions 275 where
- Page 582:
8.5 Estimation For State-Space Mode
- Page 586:
8.5 Estimation For State-Space Mode
- Page 590:
8.5 Estimation For State-Space Mode
- Page 594:
Figure 8-5 The one-step predictors
- Page 598:
8.6 State-Space Models with Missing
- Page 602:
8.6 State-Space Models with Missing
- Page 606:
8.7 The EM Algorithm 8.7 The EM Alg
- Page 610:
8.7 The EM Algorithm 291 Example 8.
- Page 614:
8.8 Generalized State-Space Models
- Page 618:
8.8 Generalized State-Space Models
- Page 622:
8.8 Generalized State-Space Models
- Page 626:
8.8 Generalized State-Space Models
- Page 630:
8.8 Generalized State-Space Models
- Page 634:
8.8 Generalized State-Space Models
- Page 638:
8.8 Generalized State-Space Models
- Page 642:
Figure 8-8 Goals scored by England
- Page 646:
8.8 Generalized State-Space Models
- Page 650:
Problems Problems 311 (see Problem
- Page 654:
Problems 313 can be expressed as Y
- Page 658:
Problems 315 and p(x2|y1) g(x2; y1
- Page 662:
9 Forecasting Techniques 9.1 The AR
- Page 666:
9.1 The ARAR Algorithm 319 and choo
- Page 670:
9.1 The ARAR Algorithm 321 9.1.4 Ap
- Page 674:
9.2 The Holt-Winters Algorithm 323
- Page 678:
Figure 9-2 The data set DEATHS.TSM
- Page 682:
Figure 9-3 The data set DEATHS.TSM
- Page 686:
Figure 9-4 The first 132 values of
- Page 690:
10Further Topics 10.1 Transfer Func
- Page 694:
10.1 Transfer Function Models 333 1
- Page 698:
10.1 Transfer Function Models 335 (
- Page 702:
Figure 10-2 The sample correlation
- Page 706:
10.1 Transfer Function Models 339 I
- Page 710:
10.2 Intervention Analysis 341 form
- Page 714:
10.3 Nonlinear Models 10.3 Nonlinea
- Page 718:
Figure 10-5 A sequence generated by
- Page 722:
10.3 Nonlinear Models 347 lation at
- Page 726:
10.3 Nonlinear Models 349 is a part
- Page 730:
Figure 10-7 A realization of the p
- Page 734:
10.3 Nonlinear Models 353 process {
- Page 738:
10.3 Nonlinear Models 355 Compariso
- Page 742:
10.4 Continuous-Time Models 357 whe
- Page 746:
10.4 Continuous-Time Models 359 i
- Page 750:
10.5 Long-Memory Models 361 and Cov
- Page 754:
10.5 Long-Memory Models 363 The spe
- Page 758:
Problems Figure 10-13 The minimum a
- Page 762:
Problems 367 c. For p ≥ 1, show t
- Page 766:
A Random Variables and Probability
- Page 770:
A.1 Distribution Functions and Expe
- Page 774:
A.1 Distribution Functions and Expe
- Page 778:
A.2 Random Vectors 375 The probabil
- Page 782:
A.3 The Multivariate Normal Distrib
- Page 786:
A.3 The Multivariate Normal Distrib
- Page 790:
Problems Problems 381 A.1. Let X ha
- Page 794:
B Statistical B.1 Least Squares Est
- Page 798:
B.1 Least Squares Estimation 385 Th
- Page 802:
B.2 Maximum Likelihood Estimation 3
- Page 806:
B.4 Hypothesis Testing 389 Example
- Page 810:
B.4 Hypothesis Testing 391 B.3.1, w
- Page 814:
C Mean C.1 The Cauchy Criterion Squ
- Page 818:
D An ITSM Tutorial D.1 Getting Star
- Page 822:
D.2 Preparing Your Data for Modelin
- Page 826:
D.2 Preparing Your Data for Modelin
- Page 830:
Figure D-2 The logged AIRPASS.TSM s
- Page 834:
D.3 Finding a Model for Your Data 4
- Page 838:
Figure D-4 The sample ACF of the tr
- Page 842:
D.3 Finding a Model for Your Data 4
- Page 846:
D.3 Finding a Model for Your Data 4
- Page 850:
D.4 Testing Your Model D.4 Testing
- Page 854:
D.4 Testing Your Model 413 frequenc
- Page 858:
D.5 Prediction D.5 Prediction 415 t
- Page 862:
D.6 Model Properties 417 of differe
- Page 866:
Figure D-12 The PACF of the model i
- Page 870:
D.7 Multivariate Time Series 421 us
- Page 874:
References Akaike, H. (1969), Fitti
- Page 878:
References 425 Dempster, A.P., Lair
- Page 882:
References 427 Mood, A.M., Graybill
- Page 886:
A accidental deaths (DEATHS.TSM), 3
- Page 890:
estimation of missing values in an
- Page 894:
polynomial fitting, 28 population o