Download PDF version - Bisnode
Download PDF version - Bisnode
Download PDF version - Bisnode

Create successful ePaper yourself
Turn your PDF publications into a flip-book with our unique Google optimized e-Paper software.
42<br />
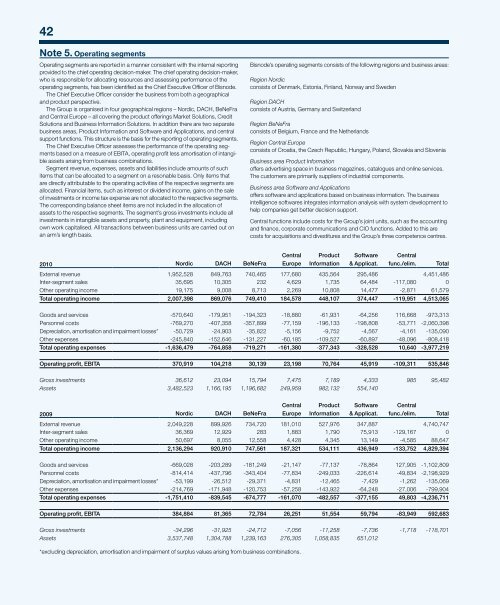
note 5. operating segments<br />
Operating segments are reported in a manner consistent with the internal reporting<br />
provided to the chief operating decision-maker. The chief operating decision-maker,<br />
who is responsible for allocating resources and assessing performance of the<br />
operating segments, has been identified as the Chief Executive Officer of <strong>Bisnode</strong>.<br />
The Chief Executive Officer consider the business from both a geographical<br />
and product perspective.<br />
The Group is organised in four geographical regions – Nordic, DACH, BeNeFra<br />
and Central Europe – all covering the product offerings Market Solutions, Credit<br />
Solutions and Business Information Solutions. In addition there are two separate<br />
business areas, Product Information and Software and Applications, and central<br />
support functions. This structure is the basis for the reporting of operating segments.<br />
The Chief Executive Officer assesses the performance of the operating segments<br />
based on a measure of EBITA, operating profit less amortisation of intangible<br />
assets arising from business combinations.<br />
Segment revenue, expenses, assets and liabilities include amounts of such<br />
items that can be allocated to a segment on a resonable basis. Only items that<br />
are directly attributable to the operating activities of the respective segments are<br />
allocated. Financial items, such as interest or dividend income, gains on the sale<br />
of investments or income tax expense are not allocated to the respective segments.<br />
The corresponding balance sheet items are not included in the allocation of<br />
assets to the respective segments. The segment’s gross investments include all<br />
investments in intangible assets and property, plant and equipment, including<br />
own work capitalised. All transactions between business units are carried out on<br />
an arm’s length basis.<br />
2010 Nordic DACH BeNeFra<br />
<strong>Bisnode</strong>’s operating segments consists of the following regions and business areas:<br />
Region Nordic<br />
consists of Denmark, Estonia, Finland, Norway and Sweden<br />
Region DACH<br />
consists of Austria, Germany and Switzerland<br />
Region BeNeFra<br />
consists of Belgium, France and the Netherlands<br />
Region Central Europe<br />
consists of Croatia, the Czech Republic, Hungary, Poland, Slovakia and Slovenia<br />
Business area Product Information<br />
offers advertising space in business magazines, catalogues and online services.<br />
The customers are primarily suppliers of industrial components.<br />
Business area Software and Applications<br />
offers software and applications based on business information. The business<br />
intelligence softwares integrates information analysis with system development to<br />
help companies get better decision support.<br />
Central functions include costs for the Group’s joint units, such as the accounting<br />
and finance, corporate communications and CIO functions. Added to this are<br />
costs for acquisitions and divestitures and the Group’s three competence centres.<br />
Central<br />
Europe<br />
Product<br />
Information<br />
Software<br />
& Applicat.<br />
Central<br />
func./elim. Total<br />
External revenue 1,952,528 849,763 740,465 177,680 435,564 295,486 4,451,486<br />
Inter-segment sales 35,695 10,305 232 4,629 1,735 64,484 -117,080 0<br />
Other operating income 19,175 9,008 8,713 2,269 10,808 14,477 -2,871 61,579<br />
Total operating income 2,007,398 869,076 749,410 184,578 448,107 374,447 -119,951 4,513,065<br />
Goods and services -570,640 -179,951 -194,323 -18,880 -61,931 -64,256 116,668 -973,313<br />
Personnel costs -769,270 -407,358 -357,899 -77,159 -196,133 -198,808 -53,771 -2,060,398<br />
Depreciation, amortisation and impairment losses* -50,729 -24,903 -35,822 -5,156 -9,752 -4,567 -4,161 -135,090<br />
Other expenses -245,840 -152,646 -131,227 -60,185 -109,527 -60,897 -48,096 -808,418<br />
Total operating expenses -1,636,479 -764,858 -719,271 -161,380 -377,343 -328,528 10,640 -3,977,219<br />
Operating profit, EBITA 370,919 104,218 30,139 23,198 70,764 45,919 -109,311 535,846<br />
Gross investments 36,612 23,094 15,794 7,475 7,189 4,333 985 95,482<br />
Assets 3,482,523 1,166,195 1,196,682 249,959 982,132 554,140<br />
2009 Nordic DACH BeNeFra<br />
Central<br />
Europe<br />
Product<br />
Information<br />
Software<br />
& Applicat.<br />
Central<br />
func./elim. Total<br />
External revenue 2,049,228 899,926 734,720 181,010 527,976 347,887 4,740,747<br />
Inter-segment sales 36,369 12,929 283 1,883 1,790 75,913 -129,167 0<br />
Other operating income 50,697 8,055 12,558 4,428 4,345 13,149 -4,585 88,647<br />
Total operating income 2,136,294 920,910 747,561 187,321 534,111 436,949 -133,752 4,829,394<br />
Goods and services -669,028 -203,289 -181,249 -21,147 -77,137 -78,864 127,905 -1,102,809<br />
Personnel costs -814,414 -437,796 -343,404 -77,834 -249,033 -226,614 -49,834 -2,198,929<br />
Depreciation, amortisation and impairment losses* -53,199 -26,512 -29,371 -4,831 -12,465 -7,429 -1,262 -135,069<br />
Other expenses -214,769 -171,948 -120,753 -57,258 -143,922 -64,248 -27,006 -799,904<br />
Total operating expenses -1,751,410 -839,545 -674,777 -161,070 -482,557 -377,155 49,803 -4,236,711<br />
Operating profit, EBITA 384,884 81,365 72,784 26,251 51,554 59,794 -83,949 592,683<br />
Gross investments -34,296 -31,925 -24,712 -7,056 -11,258 -7,736 -1,718 -118,701<br />
Assets 3,537,748 1,304,788 1,239,163 276,305 1,058,835 651,012<br />
*excluding depreciation, amortisation and impairment of surplus values arising from business combinations.