2009 Annual Report and Financial Statements - UBA Plc
2009 Annual Report and Financial Statements - UBA Plc
2009 Annual Report and Financial Statements - UBA Plc

Create successful ePaper yourself
Turn your PDF publications into a flip-book with our unique Google optimized e-Paper software.
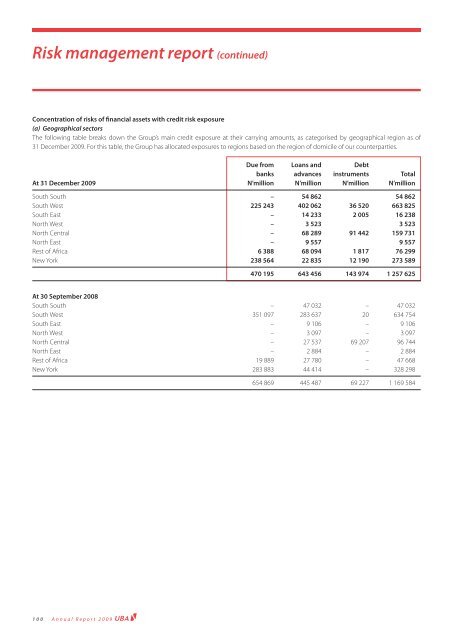
Risk management report (continued)<br />
Concentration of risks of fi nancial assets with credit risk exposure<br />
(a) Geographical sectors<br />
The following table breaks down the Group’s main credit exposure at their carrying amounts, as categorised by geographical region as of<br />
31 December <strong>2009</strong>. For this table, the Group has allocated exposures to regions based on the region of domicile of our counterparties.<br />
Due from Loans <strong>and</strong> Debt<br />
banks advances instruments Total<br />
At 31 December <strong>2009</strong> N’million N’million N’million N’million<br />
South South – 54 862 54 862<br />
South West 225 243 402 062 36 520 663 825<br />
South East – 14 233 2 005 16 238<br />
North West – 3 523 3 523<br />
North Central – 68 289 91 442 159 731<br />
North East – 9 557 9 557<br />
Rest of Africa 6 388 68 094 1 817 76 299<br />
New York 238 564 22 835 12 190 273 589<br />
100<br />
<strong>Annual</strong> <strong>Report</strong> <strong>2009</strong><br />
470 195 643 456 143 974 1 257 625<br />
At 30 September 2008<br />
South South – 47 032 – 47 032<br />
South West 351 097 283 637 20 634 754<br />
South East – 9 106 – 9 106<br />
North West – 3 097 – 3 097<br />
North Central – 27 537 69 207 96 744<br />
North East – 2 884 – 2 884<br />
Rest of Africa 19 889 27 780 – 47 668<br />
New York 283 883 44 414 – 328 298<br />
654 869 445 487 69 227 1 169 584