2009 Annual Report and Financial Statements - UBA Plc
2009 Annual Report and Financial Statements - UBA Plc
2009 Annual Report and Financial Statements - UBA Plc

Create successful ePaper yourself
Turn your PDF publications into a flip-book with our unique Google optimized e-Paper software.
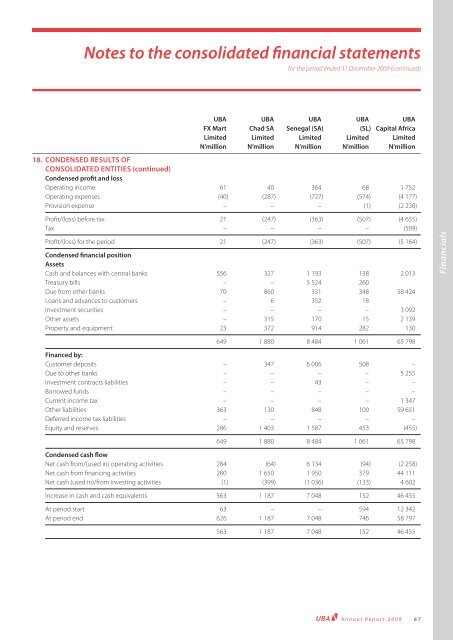
Notes to the consolidated fi nancial statements<br />
for the period ended 31 December <strong>2009</strong> (continued)<br />
<strong>UBA</strong> <strong>UBA</strong> <strong>UBA</strong> <strong>UBA</strong> <strong>UBA</strong><br />
FX Mart Chad SA Senegal (SA) (SL) Capital Africa<br />
Limited Limited Limited Limited Limited<br />
N’million N’million N’million N’million N’million<br />
18. CONDENSED RESULTS OF<br />
CONSOLIDATED ENTITIES (continued)<br />
Condensed profi t <strong>and</strong> loss<br />
Operating income 61 40 364 68 1 752<br />
Operating expenses (40) (287) (727) (574) (4 177)<br />
Provision expense – – – (1) (2 230)<br />
Profi t/(loss) before tax 21 (247) (363) (507) (4 655)<br />
Tax – – – – (509)<br />
Profi t/(loss) for the period 21 (247) (363) (507) (5 164)<br />
Condensed fi nancial position<br />
Assets<br />
Cash <strong>and</strong> balances with central banks 556 327 1 193 138 2 013<br />
Treasury bills – – 5 524 260<br />
Due from other banks 70 860 331 348 58 424<br />
Loans <strong>and</strong> advances to customers – 6 352 18<br />
Investment securities – – – – 3 092<br />
Other assets – 315 170 15 2 139<br />
Property <strong>and</strong> equipment 23 372 914 282 130<br />
649 1 880 8 484 1 061 65 798<br />
Financed by:<br />
Customer deposits – 347 6 006 508 –<br />
Due to other banks – – – – 5 255<br />
Investment contracts liabilities – – 43 – –<br />
Borrowed funds – – – – –<br />
Current income tax – – – – 1 347<br />
Other liabilities 363 130 848 100 59 651<br />
Deferred income tax liabilities – – – – –<br />
Equity <strong>and</strong> reserves 286 1 403 1 587 453 (455)<br />
649 1 880 8 484 1 061 65 798<br />
Condensed cash fl ow<br />
Net cash from/(used in) operating activities 284 (64) 6 134 (94) (2 258)<br />
Net cash from fi nancing activities 280 1 650 1 950 379 44 111<br />
Net cash (used in)/from investing activities (1) (399) (1 036) (133) 4 602<br />
Increase in cash <strong>and</strong> cash equivalents 563 1 187 7 048 152 46 455<br />
At period start 63 – – 594 12 342<br />
At period end 626 1 187 7 048 746 58 797<br />
563 1 187 7 048 152 46 455<br />
<strong>Annual</strong> <strong>Report</strong> <strong>2009</strong> 67<br />
<strong>Financial</strong>s