2009 Annual Report and Financial Statements - UBA Plc
2009 Annual Report and Financial Statements - UBA Plc
2009 Annual Report and Financial Statements - UBA Plc

You also want an ePaper? Increase the reach of your titles
YUMPU automatically turns print PDFs into web optimized ePapers that Google loves.
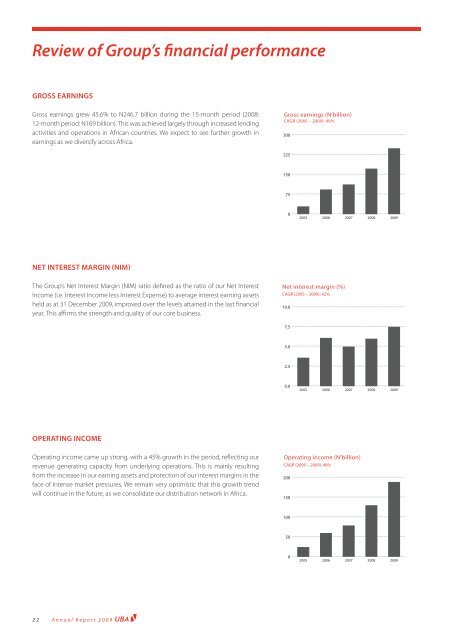
Review of Group’s fi nancial performance<br />
GROSS EARNINGS<br />
Gross earnings grew 45.6% to N246.7 billion during the 15-month period (2008:<br />
12-month period: N169 billion). This was achieved largely through increased lending<br />
activities <strong>and</strong> operations in African countries. We expect to see further growth in<br />
earnings as we diversify across Africa.<br />
NET INTEREST MARGIN (NIM)<br />
The Group’s Net Interest Margin (NIM) ratio defi ned as the ratio of our Net Interest<br />
Income (i.e. Interest Income less Interest Expense) to average interest earning assets<br />
held as at 31 December <strong>2009</strong>, improved over the levels attained in the last fi nancial<br />
year. This affi rms the strength <strong>and</strong> quality of our core business.<br />
OPERATING INCOME<br />
Operating income came up strong, with a 45% growth in the period, refl ecting our<br />
revenue generating capacity from underlying operations. This is mainly resulting<br />
from the increase in our earning assets <strong>and</strong> protection of our interest margins in the<br />
face of intense market pressures. We remain very optimistic that this growth trend<br />
will continue in the future, as we consolidate our distribution network in Africa.<br />
22<br />
<strong>Annual</strong> <strong>Report</strong> <strong>2009</strong><br />
Gross earnings (N’billion)<br />
CAGR (2005 – <strong>2009</strong>): 40%<br />
300<br />
225<br />
150<br />
75<br />
0<br />
2005<br />
2006<br />
Net interest margin (%)<br />
CAGR (2005 – <strong>2009</strong>): 42%<br />
10.0<br />
7.5<br />
5.0<br />
2.5<br />
0.0<br />
2007<br />
Operating income (N’billion)<br />
CAGR (2005 – <strong>2009</strong>): 48%<br />
200<br />
150<br />
100<br />
50<br />
0<br />
2005<br />
2005<br />
2006<br />
2006<br />
2007<br />
2007<br />
2008<br />
2008<br />
2008<br />
<strong>2009</strong><br />
<strong>2009</strong><br />
<strong>2009</strong>