2009 Annual Report and Financial Statements - UBA Plc
2009 Annual Report and Financial Statements - UBA Plc
2009 Annual Report and Financial Statements - UBA Plc

Create successful ePaper yourself
Turn your PDF publications into a flip-book with our unique Google optimized e-Paper software.
Review of Group’s fi nancial performance (continued)<br />
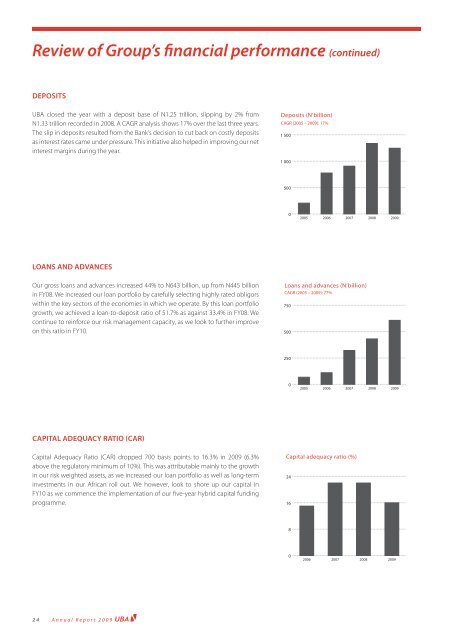
DEPOSITS<br />
<strong>UBA</strong> closed the year with a deposit base of N1.25 trillion, slipping by 2% from<br />
N1.33 trillion recorded in 2008. A CAGR analysis shows 17% over the last three years.<br />
The slip in deposits resulted from the Bank’s decision to cut back on costly deposits<br />
as interest rates came under pressure. This initiative also helped in improving our net<br />
interest margins during the year.<br />
LOANS AND ADVANCES<br />
Our gross loans <strong>and</strong> advances increased 44% to N643 billion, up from N445 billion<br />
in FY08. We increased our loan portfolio by carefully selecting highly rated obligors<br />
within the key sectors of the economies in which we operate. By this loan portfolio<br />
growth, we achieved a loan-to-deposit ratio of 51.7% as against 33.4% in FY08. We<br />
continue to reinforce our risk management capacity, as we look to further improve<br />
on this ratio in FY10.<br />
CAPITAL ADEQUACY RATIO (CAR)<br />
Capital Adequacy Ratio (CAR) dropped 700 basis points to 16.3% in <strong>2009</strong> (6.3%<br />
above the regulatory minimum of 10%). This was attributable mainly to the growth<br />
in our risk weighted assets, as we increased our loan portfolio as well as long-term<br />
investments in our African roll out. We however, look to shore up our capital in<br />
FY10 as we commence the implementation of our fi ve-year hybrid capital funding<br />
programme.<br />
24<br />
<strong>Annual</strong> <strong>Report</strong> <strong>2009</strong><br />
Deposits (N’billion)<br />
CAGR (2005 – <strong>2009</strong>): 17%<br />
1 500<br />
1 000<br />
500<br />
0<br />
Capital adequacy ratio (%)<br />
24<br />
16<br />
8<br />
0<br />
2005<br />
2006<br />
2006<br />
2007<br />
2007<br />
Loans <strong>and</strong> advances (N’billion)<br />
CAGR (2005 – <strong>2009</strong>): 77%<br />
750<br />
500<br />
250<br />
0<br />
2005<br />
2006<br />
2007<br />
2008<br />
2008<br />
2008<br />
<strong>2009</strong><br />
<strong>2009</strong><br />
<strong>2009</strong>