2009 Annual Report and Financial Statements - UBA Plc
2009 Annual Report and Financial Statements - UBA Plc
2009 Annual Report and Financial Statements - UBA Plc

Create successful ePaper yourself
Turn your PDF publications into a flip-book with our unique Google optimized e-Paper software.
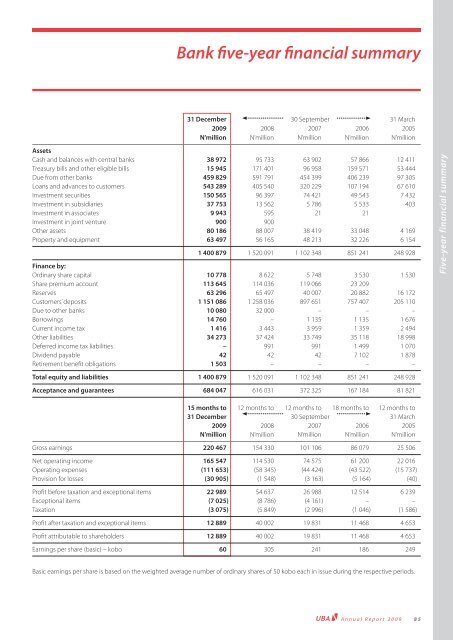
Bank fi ve-year fi nancial summary<br />
31 December 30 September 31 March<br />
<strong>2009</strong> 2008 2007 2006 2005<br />
N’million N’million N’million N’million N’million<br />
Assets<br />
Cash <strong>and</strong> balances with central banks 38 972 95 733 63 902 57 866 12 411<br />
Treasury bills <strong>and</strong> other eligible bills 15 945 171 401 96 958 159 571 53 444<br />
Due from other banks 459 829 591 791 454 399 406 239 97 305<br />
Loans <strong>and</strong> advances to customers 543 289 405 540 320 229 107 194 67 610<br />
Investment securities 150 565 96 397 74 421 49 543 7 432<br />
Investment in subsidiaries 37 753 13 562 5 786 5 533 403<br />
Investment in associates 9 943 595 21 21<br />
Investment in joint venture 900 900<br />
Other assets 80 186 88 007 38 419 33 048 4 169<br />
Property <strong>and</strong> equipment 63 497 56 165 48 213 32 226 6 154<br />
1 400 879 1 520 091 1 102 348 851 241 248 928<br />
Finance by:<br />
Ordinary share capital 10 778 8 622 5 748 3 530 1 530<br />
Share premium account 113 645 114 036 119 066 23 209<br />
Reserves 63 296 65 497 40 007 20 882 16 172<br />
Customers’ deposits 1 151 086 1 258 036 897 651 757 407 205 110<br />
Due to other banks 10 080 32 000 – – –<br />
Borrowings 14 760 – 1 135 1 135 1 676<br />
Current income tax 1 416 3 443 3 959 1 359 2 494<br />
Other liabilities 34 273 37 424 33 749 35 118 18 998<br />
Deferred income tax liabilities – 991 991 1 499 1 070<br />
Dividend payable 42 42 42 7 102 1 878<br />
Retirement benefi t obligations 1 503 – – – –<br />
Total equity <strong>and</strong> liabilities 1 400 879 1 520 091 1 102 348 851 241 248 928<br />
Acceptance <strong>and</strong> guarantees 684 047 616 031 372 325 167 184 81 821<br />
15 months to 12 months to 12 months to 18 months to 12 months to<br />
31 December 30 September 31 March<br />
<strong>2009</strong> 2008 2007 2006 2005<br />
N’million N’million N’million N’million N’million<br />
Gross earnings 220 467 154 330 101 106 86 079 25 506<br />
Net operating income 165 547 114 530 74 575 61 200 22 016<br />
Operating expenses (111 653) (58 345) (44 424) (43 522) (15 737)<br />
Provision for losses (30 905) (1 548) (3 163) (5 164) (40)<br />
Profi t before taxation <strong>and</strong> exceptional items 22 989 54 637 26 988 12 514 6 239<br />
Exceptional items (7 025) (8 786) (4 161) – –<br />
Taxation (3 075) (5 849) (2 996) (1 046) (1 586)<br />
Profi t after taxation <strong>and</strong> exceptional items 12 889 40 002 19 831 11 468 4 653<br />
Profi t attributable to shareholders 12 889 40 002 19 831 11 468 4 653<br />
Earnings per share (basic) – kobo 60 305 241 186 249<br />
Basic earnings per share is based on the weighted average number of ordinary shares of 50 kobo each in issue during the respective periods.<br />
<strong>Annual</strong> <strong>Report</strong> <strong>2009</strong> 85<br />
Five-year financial summary