- Page 1 and 2:
Optimization and Computational Flui
- Page 3 and 4:
Editors: Prof. Dr.-Ing. Dominique T
- Page 5 and 6:
vi Preface Our first research proje
- Page 7 and 8:
viii Contents 2.4.1 GoverningEquati
- Page 9 and 10:
x Contents 6.2.3 Parameterization..
- Page 11 and 12:
xii Contents 9.4.1 Multi-objectiveO
- Page 13 and 14:
xiv List of Contributors Gábor JAN
- Page 15:
Part I Generalities and methods
- Page 18 and 19:
4 Dominique Thévenin 12 10 8 6 4 2
- Page 20 and 21:
6 Dominique Thévenin Objective 10
- Page 22 and 23:
8 Dominique Thévenin Objective 10
- Page 24 and 25:
10 Dominique Thévenin Parameter 2
- Page 26 and 27:
12 Dominique Thévenin three-dimens
- Page 28 and 29:
14 Dominique Thévenin Let us come
- Page 30 and 31:
16 Dominique Thévenin References 1
- Page 32 and 33:
18 Gábor Janiga 2.1 Introduction D
- Page 34 and 35:
20 Gábor Janiga y Tinlet = 293 K 0
- Page 36 and 37:
22 Gábor Janiga y [mm] 25 20 15 10
- Page 38 and 39:
24 Gábor Janiga Table 2.1 Number o
- Page 40 and 41:
26 Gábor Janiga A dominates the in
- Page 42 and 43:
28 Gábor Janiga be shown later, th
- Page 44 and 45:
30 Gábor Janiga INPUT FILE Gambit
- Page 46 and 47:
32 Gábor Janiga y [mm] 100 50 0 0
- Page 48 and 49:
34 Gábor Janiga ∆T ∆P Position
- Page 50 and 51:
36 Gábor Janiga ∆P [mPa] 2.2 2.0
- Page 52 and 53:
38 Gábor Janiga Table 2.3 Speed-up
- Page 54 and 55:
40 Gábor Janiga For all computatio
- Page 56 and 57:
42 Gábor Janiga y [mm] 4 2 0 -1 0
- Page 58 and 59:
44 Gábor Janiga Air mass flow-rate
- Page 60 and 61:
46 Gábor Janiga Temperature variat
- Page 62 and 63:
48 Gábor Janiga y [mm] 18 16 14 12
- Page 64 and 65:
50 Gábor Janiga The modified k-ω
- Page 66 and 67:
52 Gábor Janiga Error for Re∗ =
- Page 68 and 69:
54 Gábor Janiga Error for Re∗ 20
- Page 70 and 71:
56 Gábor Janiga References 1. Ali,
- Page 72 and 73:
58 Gábor Janiga 43. Janiga, G., Th
- Page 75 and 76:
Chapter 3 Mathematical Aspects of C
- Page 77 and 78:
3 Mathematical Aspects of CFD-based
- Page 79 and 80:
3 Mathematical Aspects of CFD-based
- Page 81 and 82:
3 Mathematical Aspects of CFD-based
- Page 83 and 84:
3 Mathematical Aspects of CFD-based
- Page 85 and 86:
3 Mathematical Aspects of CFD-based
- Page 87 and 88:
3 Mathematical Aspects of CFD-based
- Page 89 and 90:
3 Mathematical Aspects of CFD-based
- Page 91 and 92:
3 Mathematical Aspects of CFD-based
- Page 93 and 94:
Chapter 4 Adjoint Methods for Shape
- Page 95 and 96:
4 Adjoint Methods for Shape Optimiz
- Page 97 and 98:
4 Adjoint Methods for Shape Optimiz
- Page 99 and 100:
4 Adjoint Methods for Shape Optimiz
- Page 101 and 102:
4 Adjoint Methods for Shape Optimiz
- Page 103 and 104:
4 Adjoint Methods for Shape Optimiz
- Page 105 and 106:
4 Adjoint Methods for Shape Optimiz
- Page 107 and 108:
4 Adjoint Methods for Shape Optimiz
- Page 109 and 110:
4 Adjoint Methods for Shape Optimiz
- Page 111 and 112:
4 Adjoint Methods for Shape Optimiz
- Page 113 and 114:
4 Adjoint Methods for Shape Optimiz
- Page 115 and 116:
4 Adjoint Methods for Shape Optimiz
- Page 117 and 118:
4 Adjoint Methods for Shape Optimiz
- Page 119 and 120:
4 Adjoint Methods for Shape Optimiz
- Page 121 and 122:
4 Adjoint Methods for Shape Optimiz
- Page 123:
Part II Specific Applications of CF
- Page 126 and 127:
112 Nicolas R. Gauger Nomenclature
- Page 128 and 129:
114 Nicolas R. Gauger Fig. 5.1 Cost
- Page 130 and 131:
116 Nicolas R. Gauger and the four
- Page 132 and 133:
118 Nicolas R. Gauger CL := 1 � C
- Page 134 and 135:
120 Nicolas R. Gauger the cost func
- Page 136 and 137:
122 Nicolas R. Gauger Table 5.1 An
- Page 138 and 139:
124 Nicolas R. Gauger The main adva
- Page 140 and 141:
126 Nicolas R. Gauger Spalart-Allma
- Page 142 and 143:
128 Nicolas R. Gauger (a) (b) Fig.
- Page 144 and 145:
130 Nicolas R. Gauger (a) (b) Fig.
- Page 146 and 147:
132 Nicolas R. Gauger (a) (b) Fig.
- Page 148 and 149:
134 Nicolas R. Gauger Fig. 5.10 Plo
- Page 150 and 151:
136 Nicolas R. Gauger drag, lift, s
- Page 152 and 153:
138 Nicolas R. Gauger solution of t
- Page 154 and 155:
140 Nicolas R. Gauger the presence
- Page 156 and 157:
142 Nicolas R. Gauger Fig. 5.16 Con
- Page 158 and 159:
144 Nicolas R. Gauger optimization
- Page 161 and 162:
Chapter 6 Numerical Optimization fo
- Page 163 and 164:
6 Numerical Optimization for Advanc
- Page 165 and 166:
6 Numerical Optimization for Advanc
- Page 167 and 168:
6 Numerical Optimization for Advanc
- Page 169 and 170:
6 Numerical Optimization for Advanc
- Page 171 and 172:
6 Numerical Optimization for Advanc
- Page 173 and 174:
6 Numerical Optimization for Advanc
- Page 175 and 176:
6 Numerical Optimization for Advanc
- Page 177 and 178:
6 Numerical Optimization for Advanc
- Page 179 and 180:
6 Numerical Optimization for Advanc
- Page 181 and 182:
6 Numerical Optimization for Advanc
- Page 183 and 184:
6 Numerical Optimization for Advanc
- Page 185 and 186:
6 Numerical Optimization for Advanc
- Page 187 and 188:
6 Numerical Optimization for Advanc
- Page 189 and 190:
6 Numerical Optimization for Advanc
- Page 191 and 192:
6 Numerical Optimization for Advanc
- Page 193 and 194:
6 Numerical Optimization for Advanc
- Page 195 and 196:
6 Numerical Optimization for Advanc
- Page 197 and 198:
6 Numerical Optimization for Advanc
- Page 199 and 200:
6 Numerical Optimization for Advanc
- Page 201 and 202:
6 Numerical Optimization for Advanc
- Page 203:
6 Numerical Optimization for Advanc
- Page 206 and 207:
192 Laurent Dumas 7.1 Introducing A
- Page 208 and 209:
194 Laurent Dumas C Fig. 7.2 Wake f
- Page 210 and 211:
196 Laurent Dumas Table 7.1 Example
- Page 212 and 213:
198 Laurent Dumas Fig. 7.5 Numerica
- Page 214 and 215:
200 Laurent Dumas 7.3.1.1 Genetic A
- Page 216 and 217:
202 Laurent Dumas START Random init
- Page 218 and 219:
204 Laurent Dumas • if ˜ J(x ng
- Page 220 and 221:
206 Laurent Dumas Table 7.3 Compari
- Page 222 and 223:
208 Laurent Dumas Fig. 7.9 General
- Page 224 and 225:
210 Laurent Dumas Table 7.4 Four ex
- Page 226 and 227:
212 Laurent Dumas Fig. 7.13 Blades
- Page 228 and 229:
214 Laurent Dumas Table 7.5 Converg
- Page 231 and 232:
Chapter 8 Multi-objective Optimizat
- Page 233 and 234:
8 Multi-objective Optimization in C
- Page 235 and 236:
8 Multi-objective Optimization in C
- Page 237 and 238:
8 Multi-objective Optimizatio Fig.
- Page 239 and 240: 8 Multi-objective Optimization in C
- Page 241 and 242: 8 Multi-objective Optimization in C
- Page 243 and 244: 8 Multi-objective Optimization in C
- Page 245 and 246: 8 Multi-objective Optimization in C
- Page 247 and 248: 8 Multi-objective Optimization in C
- Page 249 and 250: 8 Multi-objective Optimization in C
- Page 251 and 252: 8 Multi-objective Optimization in C
- Page 253 and 254: 8 Multi-objective Optimization in C
- Page 255 and 256: 8 Multi-objective Optimization in C
- Page 257 and 258: 8 Multi-objective Optimization in C
- Page 259 and 260: 8 Multi-objective Optimization in C
- Page 261 and 262: 8 Multi-objective Optimization in C
- Page 263 and 264: 8 Multi-objective Optimization in C
- Page 265 and 266: 8 Multi-objective Optimization in C
- Page 267 and 268: 8 Multi-objective Optimization in C
- Page 269 and 270: 8 Multi-objective Optimization in C
- Page 271 and 272: 8 Multi-objective Optimization in C
- Page 273 and 274: 8 Multi-objective Optimization in C
- Page 275 and 276: 8 Multi-objective Optimization in C
- Page 277 and 278: 8 Multi-objective Optimization in C
- Page 279 and 280: 8 Multi-objective Optimization in C
- Page 281 and 282: Chapter 9 CFD-based Optimization fo
- Page 283 and 284: 9 CFD-based optimization for paperm
- Page 285 and 286: 9 CFD-based optimization for paperm
- Page 287 and 288: 9 CFD-based optimization for paperm
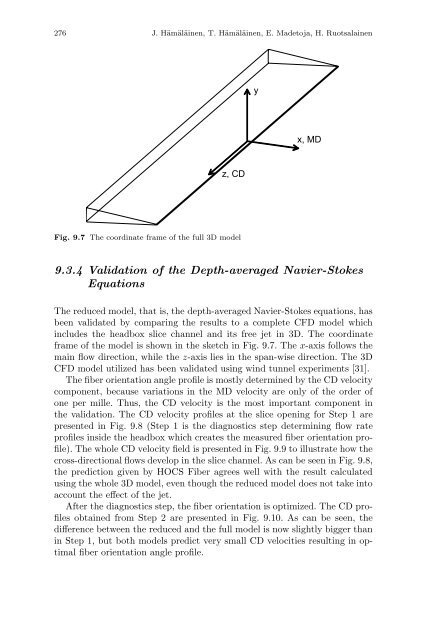
- Page 289: 9 CFD-based optimization for paperm
- Page 293 and 294: 9 CFD-based optimization for paperm
- Page 295 and 296: 9 CFD-based optimization for paperm
- Page 297 and 298: 9 CFD-based optimization for paperm
- Page 299 and 300: 9 CFD-based optimization for paperm
- Page 301 and 302: 9 CFD-based optimization for paperm
- Page 303: 9 CFD-based optimization for paperm
- Page 306 and 307: 292 Index heat exchanger, 222, 224,