Corporate - Macquarie
Corporate - Macquarie
Corporate - Macquarie

Create successful ePaper yourself
Turn your PDF publications into a flip-book with our unique Google optimized e-Paper software.
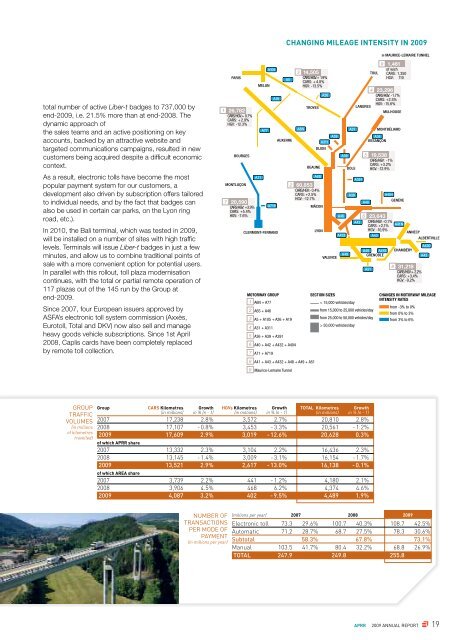
total number of active Liber-t badges to 737,000 by<br />
end-2009, i.e. 21.5% more than at end-2008. The<br />
dynamic approach of<br />
the sales teams and an active positioning on key<br />
accounts, backed by an attractive website and<br />
targeted communications campaigns, resulted in new<br />
customers being acquired despite a difficult economic<br />
context.<br />
As a result, electronic tolls have become the most<br />
popular payment system for our customers, a<br />
development also driven by subscription offers tailored<br />
to individual needs, and by the fact that badges can<br />
also be used in certain car parks, on the Lyon ring<br />
road, etc.).<br />
In 2010, the Bali terminal, which was tested in 2009,<br />
will be installed on a number of sites with high traffic<br />
levels. Terminals will issue Liber-t badges in just a few<br />
minutes, and allow us to combine traditional points of<br />
sale with a more convenient option for potential users.<br />
In parallel with this rollout, toll plaza modernisation<br />
continues, with the total or partial remote operation of<br />
117 plazas out of the 145 run by the Group at<br />
end-2009.<br />
Since 2007, four European issuers approved by<br />
ASFA’s electronic toll system commission (Axxès,<br />
Eurotoll, Total and DKV) now also sell and manage<br />
heavy goods vehicle subscriptions. Since 1st April<br />
2008, Caplis cards have been completely replaced<br />
by remote toll collection.<br />
GROuP<br />
TRAFFIC<br />
VOLuMES<br />
(in millions<br />
of kilometres<br />
travelled)<br />
Group CARS Kilometres Growth HGVs Kilometres Growth TOTAL Kilometres Growth<br />
(in millions) in % (n - 1) (in millions) in % (n - 1) (in millions) in % (n - 1)<br />
2007 17,238 2.8% 3,572 2.7% 20,810 2.8%<br />
2008 17,107 - 0.8% 3,453 - 3.3% 20,561 - 1.2%<br />
2009 17,609 2.9% 3,019 - 12.6% 20,628 0.3%<br />
of which APRR share<br />
2007 13,332 2.3% 3,104 2.2% 16,436 2.3%<br />
2008 13,145 - 1.4% 3,009 - 3.1% 16,154 - 1.7%<br />
2009 13,521 2.9% 2,617 - 13.0% 16,138 - 0.1%<br />
of which AREA share<br />
2007 3,739 2.2% 441 - 1.2% 4,180 2.1%<br />
2008 3,906 4.5% 468 6.2% 4,374 4.6%<br />
2009 4,087 3.2% 402 - 9.5% 4,489 1.9%<br />
nuMBER OF<br />
TRAnSACTIOnS<br />
PER MODE OF<br />
PAYMEnT<br />
(in millions per year)<br />
Paris<br />
1 26,782<br />
CARS / HGV : + 0.7%<br />
CARS: + 2.9%<br />
HGV: -12.3%<br />
Bourges<br />
montluçon<br />
7 20,590<br />
CARS / HGV : +3.9%<br />
CARS: +5.4%<br />
HGV: -7.6%<br />
melun<br />
A71<br />
A77<br />
A105<br />
A719<br />
A19<br />
Clermont-ferrand<br />
MOTORWAY GROUP<br />
1 A6N + A77<br />
2 A6S + A46<br />
A5<br />
auxerre<br />
3 A5 + A105 + A26 + A19<br />
4 A31 + A311<br />
5 A36 + A39 + A391<br />
6 A40 + A42 + A432 + A404<br />
7 A71 + A719<br />
3 14,505<br />
CARS / HGV : + 1.9%<br />
CARS: + 4.8%<br />
HGV: -13.5%<br />
A6N<br />
troyes<br />
A6S<br />
2 60,853<br />
CARS / HGV : - 0.4%<br />
CARS: +2.5%<br />
HGV: -12.7%<br />
mÂCon<br />
8 A41 + A43 + A432 + A48 + A49 + A51<br />
9 Maurice-Lemaire Tunnel<br />
CHANGING MILEAGE INTENSITY IN 2009<br />
A39<br />
A311<br />
dijon<br />
Beaune dole<br />
lyon<br />
A26<br />
valenCe<br />
mauriCe-lemaire tunnel<br />
9 1,461<br />
of wich<br />
toul CARS : 1,350<br />
HGV : 110<br />
4 23,296<br />
CARS / HGV : -1.7%<br />
CARS: +2.5%<br />
HGV: -15.6%<br />
langres<br />
mulhouse<br />
montBéliard<br />
A36<br />
Besançon<br />
A48 A41S<br />
grenoBle<br />
A404<br />
genève<br />
ChamBéry<br />
(millions per year) 2007 2008 2009<br />
Electronic toll 73.3 29.6% 100.7 40.3% 108.7 42.5%<br />
Automatic 71.2 28.7% 68.7 27.5% 78.3 30.6%<br />
Subtotal 58.3% 67.8% 73.1%<br />
Manual 103.5 41.7% 80.4 32.2% 68.8 26.9%<br />
TOTAL 247.9 249.8 255.8<br />
A46<br />
A39<br />
A432<br />
A49<br />
A31<br />
A39<br />
A391<br />
5 19,538<br />
CARS / HGV : -1%<br />
CARS: +3.2%<br />
HGV: -12.9%<br />
A40<br />
6 23,643<br />
A42 CARS / HGV : -0,1%<br />
CARS: +2,1% A41N<br />
HGV: -10,9%<br />
A43<br />
anneCy<br />
alBertville<br />
A51<br />
SECTION SIZES<br />
< 15,000 vehicles/day<br />
from 15,000 to 25,000 vehicles/day<br />
from 25,000 to 50,000 vehicles/day<br />
> 50,000 vehicles/day<br />
8 31,218<br />
CARS / HGV : + 2.2%<br />
CARS: +3,4%<br />
HGV: -9,2%<br />
APRR 2009 AnnuAL REPORT<br />
A430<br />
A43<br />
CHANGES IN MOTORWAY MILEAGE<br />
INTENSITY RATES<br />
from -3% to 0%<br />
from 0% to 3%<br />
from 3% to 6%<br />
19