enlace - Colegio Oficial de Ingenieros Industriales de Madrid
enlace - Colegio Oficial de Ingenieros Industriales de Madrid
enlace - Colegio Oficial de Ingenieros Industriales de Madrid
Create successful ePaper yourself
Turn your PDF publications into a flip-book with our unique Google optimized e-Paper software.
artículo<br />
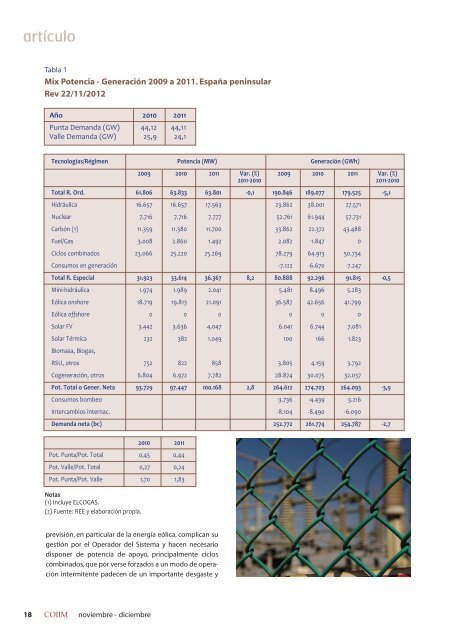
Tabla 1<br />
Mix Potencia - Generación 2009 a 2011. España peninsular<br />
Rev 22/11/2012<br />
Año 2010 2011<br />
Punta Demanda (GW) 44,12 44,11<br />
Valle Demanda (GW) 25,9 24,1<br />
Tecnologías/Régimen Potencia (MW) Generación (GWh)<br />
previsión, en particular <strong>de</strong> la energía eólica, complican su<br />
gestión por el Operador <strong>de</strong>l Sistema y hacen necesario<br />
disponer <strong>de</strong> potencia <strong>de</strong> apoyo, principalmente ciclos<br />
combinados, que por verse forzados a un modo <strong>de</strong> operación<br />
intermitente pa<strong>de</strong>cen <strong>de</strong> un importante <strong>de</strong>sgaste y<br />
18 COIIM noviembre - diciembre<br />
2009 2010 2011 Var. (%) 2009 2010 2011 Var. (%)<br />
20112010 20112010<br />
Total R. Ord. 61.806 63.833 63.801 0,1 190.846 189.077 179.525 5,1<br />
Hidráulica 16.657 16.657 17.563 23.862 38.001 27.571<br />
Nuclear 7.716 7.716 7.777 52.761 61.944 57.731<br />
Carbón (1) 11.359 11.380 11.700 33.862 22.372 43.488<br />
Fuel/Gas 3.008 2.860 1.492 2.082 1.847 0<br />
Ciclos combinados 23.066 25.220 25.269 78.279 64.913 50.734<br />
Consumos en generación 7.122 6.670 7.247<br />
Total R. Especial 31.923 33.614 36.367 8,2 80.888 92.296 91.815 0,5<br />
Minihidráulica 1.974 1.989 2.041 5.481 8.496 5.283<br />
Eólica onshore 18.719 19.813 21.091 36.587 42.656 41.799<br />
Eólica offshore 0 0 0 0 0 0<br />
Solar FV 3.442 3.636 4.047 6.041 6.744 7.081<br />
Solar Térmica 232 382 1.049 100 166 1.823<br />
Biomasa, Biogas,<br />
RSU, otros 752 822 858 3.805 4.159 3.792<br />
Cogeneración, otros 6.804 6.972 7.782 28.874 30.075 32.037<br />
Pot. Total o Gener. Neta 93.729 97.447 100.168 2,8 264.612 274.703 264.093 3,9<br />
Consumos bombeo 3.736 4.439 3.216<br />
Intercambios internac. 8.104 8.490 6.090<br />
Demanda neta (bc) 252.772 261.774 254.787 2,7<br />
Notas<br />
(1) Incluye ELCOGAS.<br />
(2) Fuente: REE y elaboración propia.<br />
2010 2011<br />
Pot. Punta/Pot. Total 0,45 0,44<br />
Pot. Valle/Pot. Total 0,27 0,24<br />
Pot. Punta/Pot. Valle 1,70 1,83


