Informe del PRISE - Auditoría General de la Nación
Informe del PRISE - Auditoría General de la Nación
Informe del PRISE - Auditoría General de la Nación

Create successful ePaper yourself
Turn your PDF publications into a flip-book with our unique Google optimized e-Paper software.
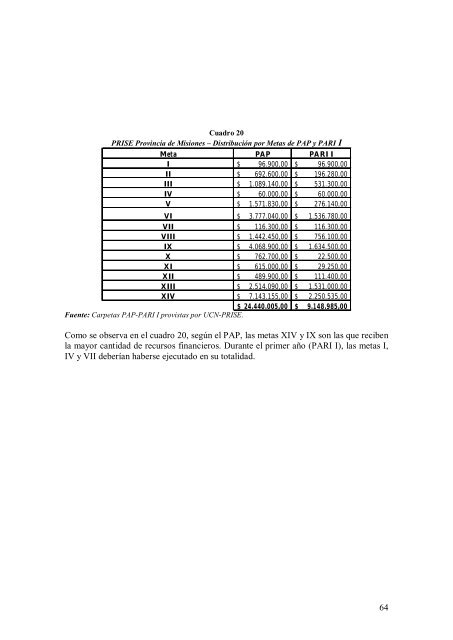
Cuadro 20<br />
<strong>PRISE</strong> Provincia <strong>de</strong> Misiones – Distribución por Metas <strong>de</strong> PAP y PARI I<br />
Meta PAP PARI I<br />
I $ 96.900,00 $ 96.900,00<br />
II $ 692.600,00 $ 196.280,00<br />
III $ 1.089.140,00 $ 531.300,00<br />
IV $ 60.000,00 $ 60.000,00<br />
V $ 1.571.830,00 $ 276.140,00<br />
VI $ 3.777.040,00 $ 1.536.780,00<br />
VII $ 116.300,00 $ 116.300,00<br />
VIII $ 1.442.450,00 $ 756.100,00<br />
IX $ 4.068.900,00 $ 1.634.500,00<br />
X $ 762.700,00 $ 22.500,00<br />
XI $ 615.000,00 $ 29.250,00<br />
XII $ 489.900,00 $ 111.400,00<br />
XIII $ 2.514.090,00 $ 1.531.000,00<br />
XIV $ 7.143.155,00 $ 2.250.535,00<br />
$ 24.440.005,00 $ 9.148.985,00<br />
Fuente: Carpetas PAP-PARI I provistas por UCN-<strong>PRISE</strong>.<br />
Como se observa en el cuadro 20, según el PAP, <strong>la</strong>s metas XIV y IX son <strong>la</strong>s que reciben<br />
<strong>la</strong> mayor cantidad <strong>de</strong> recursos financieros. Durante el primer año (PARI I), <strong>la</strong>s metas I,<br />
IV y VII <strong>de</strong>berían haberse ejecutado en su totalidad.<br />
64