Tratado de Libre Comercio con los Estados Unidos
Tratado de Libre Comercio con los Estados Unidos
Tratado de Libre Comercio con los Estados Unidos

You also want an ePaper? Increase the reach of your titles
YUMPU automatically turns print PDFs into web optimized ePapers that Google loves.
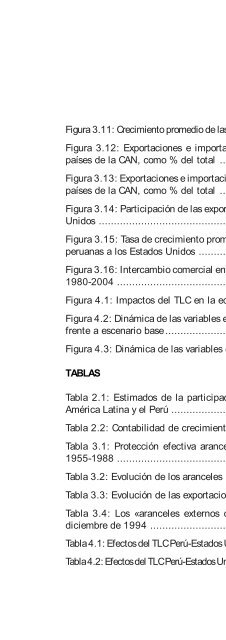
Figura 3.11: Crecimiento promedio <strong>de</strong> las exportaciones peruanas a la CAN<br />
Figura 3.12: Exportaciones e importaciones <strong>de</strong>l Perú hacia o <strong>de</strong>s<strong>de</strong><br />
países <strong>de</strong> la CAN, como % <strong>de</strong>l total .............................................<br />
Figura 3.13: Exportaciones e importaciones <strong>de</strong> Colombia hacia o <strong>de</strong>s<strong>de</strong><br />
países <strong>de</strong> la CAN, como % <strong>de</strong>l total .............................................<br />
Figura 3.14: Participación <strong>de</strong> las exportaciones peruanas a <strong>los</strong> <strong>Estados</strong><br />
<strong>Unidos</strong> .....................................................................................<br />
Figura 3.15: Tasa <strong>de</strong> crecimiento promedio anual <strong>de</strong> las exportaciones<br />
peruanas a <strong>los</strong> <strong>Estados</strong> <strong>Unidos</strong> ....................................................<br />
Figura 3.16: Intercambio comercial entre el Perú y <strong>los</strong> <strong>Estados</strong> <strong>Unidos</strong>,<br />
1980-2004 ...............................................................................<br />
Figura 4.1: Impactos <strong>de</strong>l TLC en la e<strong>con</strong>omía peruana ...................<br />
Figura 4.2: Dinámica <strong>de</strong> las variables endógenas: escenario alternativo<br />
frente a escenario base ...............................................................<br />
Figura 4.3: Dinámica <strong>de</strong> las variables exógenas ..............................<br />
169<br />
172<br />
173<br />
176<br />
177<br />
178<br />
222<br />
224<br />
235<br />
TABLAS<br />
Tabla 2.1: Estimados <strong>de</strong> la participación <strong>de</strong>l capital en estudios <strong>de</strong><br />
América Latina y el Perú .............................................................<br />
Tabla 2.2: Contabilidad <strong>de</strong> crecimiento <strong>de</strong> la e<strong>con</strong>omía peruana ......<br />
Tabla 3.1: Protección efectiva arancelaria por sectores productivos,<br />
1955-1988 ...............................................................................<br />
Tabla 3.2: Evolución <strong>de</strong> <strong>los</strong> aranceles ...........................................<br />
Tabla 3.3: Evolución <strong>de</strong> las exportaciones peruanas al Mercosur ......<br />
Tabla 3.4: Los «aranceles externos comunes» <strong>de</strong>l Grupo Andino –<br />
diciembre <strong>de</strong> 1994 ....................................................................<br />
Tabla 4.1: Efectos <strong>de</strong>l TLC Perú-<strong>Estados</strong> <strong>Unidos</strong> según Cuadra et al. (2004)<br />
Tabla 4.2: Efectos <strong>de</strong>l TLC Perú-<strong>Estados</strong> <strong>Unidos</strong> según Rodríguez et al. (2004)<br />
41<br />
49<br />
140<br />
151<br />
167<br />
171<br />
195<br />
198