La Educación Media Superior en México - Instituto Nacional para la ...
La Educación Media Superior en México - Instituto Nacional para la ...
La Educación Media Superior en México - Instituto Nacional para la ...

Create successful ePaper yourself
Turn your PDF publications into a flip-book with our unique Google optimized e-Paper software.
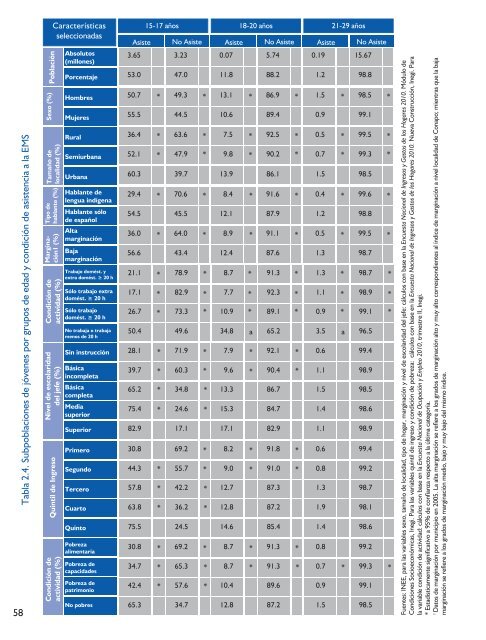
Tab<strong>la</strong> 2.4. Subpob<strong>la</strong>ciones de jóv<strong>en</strong>es por grupos de edad y condición de asist<strong>en</strong>cia a <strong>la</strong> EMS<br />
58<br />
<br />
Sexo (%)<br />
<br />
<br />
-<br />
<br />
<br />
<br />
<br />
<br />
<br />
<br />
<br />
Características<br />
seleccionadas<br />
<br />
<br />
<br />
<br />
<br />
Rural<br />
<br />
<br />
<br />
<br />
<br />
<br />
Alta<br />
<br />
Baja<br />
<br />
<br />
<br />
<br />
<br />
<br />
<br />
<br />
<br />
<br />
<br />
<br />
<br />
<br />
<br />
<br />
<br />
<br />
<br />
Tercero<br />
Cuarto<br />
<br />
<br />
<br />
<br />
<br />
<br />
<br />
<br />
15-17 años 18-20 años 21-29 años<br />
Asiste No Asiste Asiste No Asiste Asiste No Asiste<br />
3.65 3.23 0.07 5.74 0.19 15.67<br />
53.0 47.0 11.8 88.2 1.2 98.8<br />
50.7 * 49.3 * 13.1 * 86.9 * 1.5 * 98.5 *<br />
55.5 44.5 10.6 89.4 0.9 99.1<br />
36.4 * 63.6 * 7.5 * 92.5 * 0.5 * 99.5 *<br />
52.1 * 47.9 * 9.8 * 90.2 * 0.7 * 99.3 *<br />
60.3 39.7 13.9 86.1 1.5 98.5<br />
29.4 * 70.6 * 8.4 * 91.6 * 0.4 * 99.6 *<br />
54.5 45.5 12.1 87.9 1.2 98.8<br />
36.0 * 64.0 * 8.9 * 91.1 * 0.5 * 99.5 *<br />
56.6 43.4 12.4 87.6 1.3 98.7<br />
21.1 * 78.9 * 8.7 * 91.3 * 1.3 * 98.7 *<br />
17.1 * 82.9 * 7.7 * 92.3 * 1.1 * 98.9 *<br />
26.7 * 73.3 * 10.9 * 89.1 * 0.9 * 99.1 *<br />
50.4 49.6 34.8 a 65.2 3.5 a 96.5<br />
28.1 * 71.9 * 7.9 * 92.1 * 0.6 99.4<br />
39.7 * 60.3 * 9.6 * 90.4 * 1.1 98.9<br />
65.2 * 34.8 * 13.3 86.7 1.5 98.5<br />
75.4 * 24.6 * 15.3 84.7 1.4 98.6<br />
82.9 17.1 17.1 82.9 1.1 98.9<br />
30.8 69.2 * 8.2 * 91.8 * 0.6 99.4<br />
44.3 * 55.7 * 9.0 * 91.0 * 0.8 99.2<br />
57.8 * 42.2 * 12.7 87.3 1.3 98.7<br />
63.8 * 36.2 * 12.8 87.2 1.9 98.1<br />
75.5 24.5 14.6 85.4 1.4 98.6<br />
30.8 * 69.2 * 8.7 * 91.3 * 0.8 99.2<br />
34.7 * 65.3 * 8.7 * 91.3 * 0.7 * 99.3 *<br />
42.4 * 57.6 * 10.4 89.6 0.9 99.1<br />
65.3 34.7 12.8 87.2 1.5 98.5<br />
Fu<strong>en</strong>tes: INEE, <strong>para</strong> <strong>la</strong>s variables sexo, tamaño de localidad, tipo de hogar, marginación y nivel de esco<strong>la</strong>ridad del jefe: cálculos con base <strong>en</strong> <strong>la</strong> Encuesta <strong>Nacional</strong> de Ingresos y Gastos de los Hogares 2010. Módulo de<br />
Condiciones Socioeconómicas, Inegi. Para <strong>la</strong>s variables quintil de ingreso y condición de pobreza: cálculos con base <strong>en</strong> <strong>la</strong> Encuesta <strong>Nacional</strong> de Ingresos y Gastos de los Hogares 2010. Nueva Construcción, Inegi. Para<br />
<strong>la</strong> variable condición de actividad: cálculos con base <strong>en</strong> <strong>la</strong> Encuesta <strong>Nacional</strong> de Ocupación y Empleo 2010, trimestre II, Inegi.<br />
<br />
1