las comunidades de peces del río guadiamar y el accidente minero ...
las comunidades de peces del río guadiamar y el accidente minero ...
las comunidades de peces del río guadiamar y el accidente minero ...

Create successful ePaper yourself
Turn your PDF publications into a flip-book with our unique Google optimized e-Paper software.
Las <strong>comunida<strong>de</strong>s</strong> <strong>de</strong> <strong>peces</strong> <strong>de</strong>l <strong>río</strong> Guadiamar<br />
y <strong>el</strong> acci<strong>de</strong>nte <strong>minero</strong> <strong>de</strong> Aznalcóllar<br />
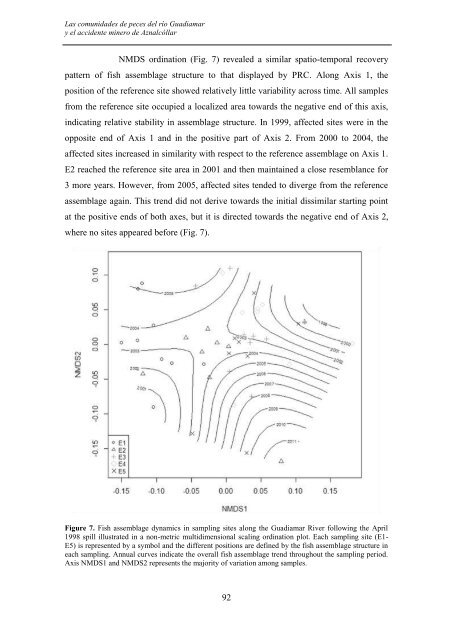
NMDS ordination (Fig. 7) revealed a similar spatio-temporal recovery<br />
pattern of fish assemblage structure to that displayed by PRC. Along Axis 1, the<br />
position of the reference site showed r<strong>el</strong>ativ<strong>el</strong>y little variability across time. All samples<br />
from the reference site occupied a localized area towards the negative end of this axis,<br />
indicating r<strong>el</strong>ative stability in assemblage structure. In 1999, affected sites were in the<br />
opposite end of Axis 1 and in the positive part of Axis 2. From 2000 to 2004, the<br />
affected sites increased in similarity with respect to the reference assemblage on Axis 1.<br />
E2 reached the reference site area in 2001 and then maintained a close resemblance for<br />
3 more years. However, from 2005, affected sites ten<strong>de</strong>d to diverge from the reference<br />
assemblage again. This trend did not <strong>de</strong>rive towards the initial dissimilar starting point<br />
at the positive ends of both axes, but it is directed towards the negative end of Axis 2,<br />
where no sites appeared before (Fig. 7).<br />
Figure 7. Fish assemblage dynamics in sampling sites along the Guadiamar River following the April<br />
1998 spill illustrated in a non-metric multidimensional scaling ordination plot. Each sampling site (E1-<br />
E5) is represented by a symbol and the different positions are <strong>de</strong>fined by the fish assemblage structure in<br />
each sampling. Annual curves indicate the overall fish assemblage trend throughout the sampling period.<br />
Axis NMDS1 and NMDS2 represents the majority of variation among samples.<br />
92