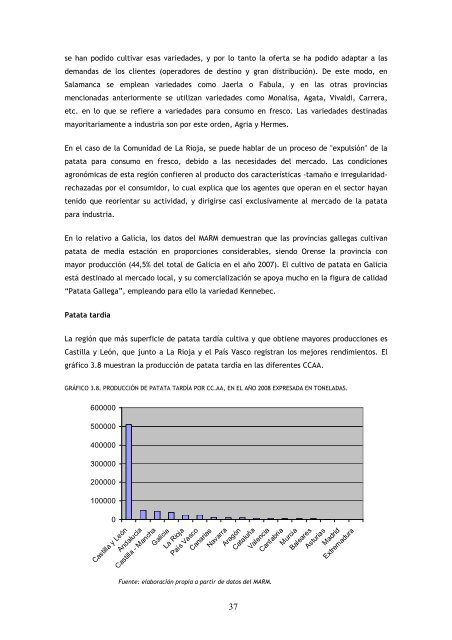
se han podido cultivar esas varieda<strong>de</strong>s, y por lo tanto <strong>la</strong> oferta se ha podido adaptar a <strong>la</strong>s <strong>de</strong>mandas <strong>de</strong> los clientes (operadores <strong>de</strong> <strong>de</strong>stino y gran distribución). De este modo, en Sa<strong>la</strong>manca se emplean varieda<strong>de</strong>s como Jaer<strong>la</strong> o Fabu<strong>la</strong>, y en <strong>la</strong>s otras provincias mencionadas anteriormente se utilizan varieda<strong>de</strong>s como Monalisa, Agata, Vivaldi, Carrera, etc. en lo que se refiere a varieda<strong>de</strong>s para consumo en fresco. Las varieda<strong>de</strong>s <strong>de</strong>stinadas mayoritariamente a industria son por este or<strong>de</strong>n, Agria y Hermes. En el caso <strong>de</strong> <strong>la</strong> Comunidad <strong>de</strong> La Rioja, se pue<strong>de</strong> hab<strong>la</strong>r <strong>de</strong> un proceso <strong>de</strong> "expulsión" <strong>de</strong> <strong>la</strong> patata para consumo en fresco, <strong>de</strong>bido a <strong>la</strong>s necesida<strong>de</strong>s <strong>de</strong>l mercado. Las condiciones agronómicas <strong>de</strong> esta región confieren al producto dos características -tamaño e irregu<strong>la</strong>ridadrechazadas por el consumidor, lo cual explica que los agentes que operan en el sector hayan tenido que reorientar su actividad, y dirigirse casi exclusivamente al mercado <strong>de</strong> <strong>la</strong> patata para industria. En lo re<strong>la</strong>tivo a Galicia, los datos <strong>de</strong>l MARM <strong>de</strong>muestran que <strong>la</strong>s provincias gallegas cultivan patata <strong>de</strong> media estación en proporciones consi<strong>de</strong>rables, siendo Orense <strong>la</strong> provincia con mayor producción (44,5% <strong>de</strong>l total <strong>de</strong> Galicia en el año 2007). El cultivo <strong>de</strong> patata en Galicia está <strong>de</strong>stinado al mercado local, y su comercialización se apoya mucho en <strong>la</strong> figura <strong>de</strong> calidad “<strong>Patata</strong> Gallega”, empleando para ello <strong>la</strong> variedad Kennebec. <strong>Patata</strong> tardía La región que más superficie <strong>de</strong> patata tardía cultiva y que obtiene mayores producciones es Castil<strong>la</strong> y León, que junto a La Rioja y el País Vasco registran los mejores rendimientos. El gráfico 3.8 muestran <strong>la</strong> producción <strong>de</strong> patata tardía en <strong>la</strong>s diferentes CCAA. GRÁFICO 3.8. PRODUCCIÓN DE PATATA TARDÍA POR CC.AA, EN EL AÑO 2008 EXPRESADA EN TONELADAS. 600000 500000 400000 300000 200000 100000 0 Castil<strong>la</strong> y León Andalucía Castil<strong>la</strong> - Mancha Galicia La Rioja País Vasco Canarias Navarra Aragón Cataluña Valencia Cantabria Fuente: e<strong>la</strong>boración propia a partir <strong>de</strong> datos <strong>de</strong>l MARM. 37 Murcia Baleares Asturias Madrid Extremadura
Por su parte, <strong>la</strong> tab<strong>la</strong> 3.8 muestra <strong>la</strong> superficie, producción y rendimientos <strong>de</strong> patata tardía por CCAA. TABLA 3.8. SUPERFICIE, PRODUCCIÓN Y RENDIMIENTO DE PATATA TARDÍA, POR CC.AA. Superficie (ha) Producciones (1.000 t) Rendimiento (t/ha) 2006 2007 2008 2006 2007 2008 2006 2007 2008 Galicia 1.362 1.305 1.815 27,0 24,3 36,9 19,80 18,59 20,33 Asturias 100 100 100 2,5 2,5 1,5 25,00 25,00 15,00 Cantabria 350 247 250 6,3 4,1 5,6 17,98 16,54 22,40 País Vasco 1.172 1.111 922 40,9 36,8 23,9 34,88 33,08 25,92 Navarra 474 443 481 10,5 10,3 10,0 22,15 23,31 20,79 La Rioja 550 612 567 27,8 31,7 25,8 50,50 51,86 45,50 Aragón 287 296 301 6,2 8,7 9,0 21,72 29,30 29,90 Cataluña 306 531 373 6,7 11,1 8,4 21,81 20,90 22,52 Baleares 190 200 200 5,2 5,5 5,5 27,50 27,50 27,50 Castil<strong>la</strong> y León 11.683 13.828 12.915 474,6 533,3 512,7 40,62 38,57 39,70 Madrid 44 30 – 1,1 0,8 – 25,00 25,00 – Castil<strong>la</strong> - Mancha 1.137 881 1.614 29,1 21,9 44,3 25,55 24,88 27,45 Valencia 510 498 441 8,7 8,2 7,4 17,15 16,41 16,78 Murcia 358 353 350 5,9 5,7 5,6 16,44 16,05 16,00 Extremadura – – – – – – – – – Andalucía 2.537 2.367 2.229 61,8 58,4 51,1 24,34 24,66 22,93 Canarias 770 724 760 13,4 12,4 12,5 17,41 17,14 16,45 España 21.830 23.526 23.230 727,6 775,7 756,6 33,33 32,97 32,57 Fuente: E<strong>la</strong>boración propia a partir <strong>de</strong> datos <strong>de</strong>l MARM; -: Datos no disponibles. La patata tardía ha registrado un ligero aumento en términos <strong>de</strong> peso re<strong>la</strong>tivo con respecto a <strong>la</strong> producción <strong>de</strong> patata total españo<strong>la</strong> a lo <strong>la</strong>rgo <strong>de</strong> <strong>la</strong> última década. Sin embargo, <strong>de</strong>s<strong>de</strong> 1992 (fecha <strong>de</strong> <strong>la</strong> imp<strong>la</strong>ntación <strong>de</strong> <strong>la</strong> Reforma <strong>de</strong> <strong>la</strong> PAC), se ha producido un <strong>de</strong>scenso <strong>de</strong> <strong>la</strong> producción <strong>de</strong> patata <strong>de</strong> media estación y tardía, <strong>de</strong>bido a su <strong>de</strong>sp<strong>la</strong>zamiento por cultivos con mayor protección pública (cereales, forrajes, etc.). Gran parte <strong>de</strong> los agricultores <strong>de</strong> patata <strong>de</strong> media estación y tardía consi<strong>de</strong>raban el cultivo <strong>de</strong> patata como un elemento "secundario" <strong>de</strong> su rotación, que queda supeditado a <strong>la</strong>s <strong>de</strong>cisiones re<strong>la</strong>tivas <strong>de</strong> otros cultivos más rentables, visión que sobre todo en los dos últimos años ha cambiado. Estructura <strong>de</strong> <strong>la</strong> producción <strong>de</strong> patata tardía <strong>de</strong> Castil<strong>la</strong> y León Castil<strong>la</strong> y León produce el 67,3% <strong>de</strong>l total nacional <strong>de</strong> <strong>la</strong> patata tardía. La provincia que más patata tardía produjo en 2008 fue Val<strong>la</strong>dolid, con el 38,5% <strong>de</strong>l total regional, estando el resto <strong>de</strong> <strong>la</strong> producción más repartida en <strong>la</strong>s restantes provincias, como indica <strong>la</strong> tab<strong>la</strong> 3.9. 38
- Page 1 and 2: Plan Estratégico de la Patata de C
- Page 3 and 4: • Los mayores rendimientos por he
- Page 6 and 7: JUSTIFICACIÓN DEL PLAN El sector d
- Page 8: ANÁLISIS Y DIAGNÓSTICO DEL SECTOR
- Page 11 and 12: 11.4 LA PATATA DE SIEMBRA EN ESPAÑ
- Page 13 and 14: patata hayan suscrito un contrato d
- Page 15 and 16: CONCLUSIONES o o o La patata es un
- Page 17 and 18: TABLA 2.1. PRODUCCIÓN MUNDIAL DE P
- Page 19 and 20: GRÁFICO 2.2. PAÍSES CON MAYOR SUP
- Page 21 and 22: 2.2 PRODUCCIÓN, SUPERFICIE Y RENDI
- Page 23 and 24: TABLA 2.5. SUPERFICIE DE PATATA EN
- Page 25 and 26: GRÁFICO 2.7. PAÍSES DE LA UE (27)
- Page 27 and 28: CONCLUSIONES o o o A nivel mundial
- Page 29 and 30: Sin embargo, la patata extratempran
- Page 31 and 32: GRÁFICO 3.3. EVOLUCIÓN DE LA SUPE
- Page 33 and 34: El rendimiento medio en producción
- Page 35 and 36: GRÁFICO 3.5. PORCENTAJE QUE REPRES
- Page 37 and 38: GRÁFICO 3.8. IMPORTANCIA, EXPRESAD
- Page 39: En el gráfico 3.7 se expone la pro
- Page 43 and 44: GRÁFICO 3.8. CALENDARIO DE COMERCI
- Page 45 and 46: CONCLUSIONES o o o o o o La producc
- Page 47 and 48: La renta agraria en Castilla y Leó
- Page 49 and 50: TABLA 4.2. PRODUCCIÓN (t), SUPERFI
- Page 51 and 52: El rendimiento medio de patata en C
- Page 53 and 54: TABLA 4.3. SUPERFICIE, RENDIMIENTO
- Page 55 and 56: Al considerar la patata de media es
- Page 57 and 58: TABLA 4.5. SUPERFICIE DE PATATA EN
- Page 59 and 60: 4.2 LA PRODUCCIÓN INTEGRADA EN CAS
- Page 61 and 62: Como se observa en la gráfica, dur
- Page 64 and 65: 5 ANÁLISIS DEL COMERCIO EXTERIOR D
- Page 66 and 67: que las relaciones comerciales son
- Page 68 and 69: Las exportaciones de la UE se reali
- Page 70 and 71: 6 ANÁLISIS DEL COMERCIO EXTERIOR D
- Page 72 and 73: Antes de entrar en la UE los princi
- Page 74 and 75: En la tabla 6.3 aparecen los datos
- Page 76 and 77: sustancialmente siempre y cuando se
- Page 78 and 79: De todas las exportaciones español
- Page 80 and 81: En la tabla 6.10 figuran las export
- Page 82 and 83: En la tabla 6.14 se exponen las can
- Page 84 and 85: 6.3 COMPARACIÓN DE LAS IMPORTACION
- Page 86 and 87: La información anterior sobre Cast
- Page 88 and 89: 7 ESTIMACIÓN DE LOS COSTES DE PROD
- Page 90 and 91:
TABLA 7.1. PRECIOS DE PATATA IMPORT
- Page 92 and 93:
8 ESTUDIO DE LOS PRECIOS DE PATATA
- Page 94 and 95:
suelen ser las de más calidad visu
- Page 96 and 97:
GRÁFICO 8.3. PRECIOS MEDIOS PAGADO
- Page 98 and 99:
GRÁFICO 8.7. PRECIOS MEDIOS DE PAT
- Page 100:
CONCLUSIONES o o o o o La producci
- Page 103 and 104:
En cuanto al grado de autoabastecim
- Page 105 and 106:
Lugar de Residencia Aquellos consum
- Page 107 and 108:
Madrid Patatas frescas 115.846,26 7
- Page 109 and 110:
Vinculación al origen del producto
- Page 111 and 112:
Durante el año 2008, Castilla y Le
- Page 113 and 114:
CONCLUSIONES o o o o Tendencia desc
- Page 115 and 116:
El acceso de las cooperativas a la
- Page 117 and 118:
de consumo en fresco lo cual permit
- Page 119 and 120:
Las particularidades de estas agrup
- Page 121 and 122:
A modo de resumen y para cerrar est
- Page 123 and 124:
10.2.3 CRITERIOS DE COMERCIALIZACI
- Page 125 and 126:
10.2.4 INTERMEDIARIOS COMERCIALIZAD
- Page 127 and 128:
Formatos de gran capacidad y poco e
- Page 129 and 130:
productores a los cuales les sumini
- Page 131 and 132:
En el conjunto de la comunidad aut
- Page 133 and 134:
ANEXO I : CADENA DE VALOR DE LA PAT
- Page 135 and 136:
132
- Page 137 and 138:
134
- Page 139 and 140:
De hecho, los datos ofrecidos por F
- Page 141 and 142:
TABLA 11.1 SUPERFICIE DE PATATA DE
- Page 143 and 144:
11.3 COMERCIO DE LA PATATA DE SIEMB
- Page 145 and 146:
Como se puede observar en la gráfi
- Page 147 and 148:
Las importaciones de los países de
- Page 149 and 150:
11.4 LA PATATA DE SIEMBRA EN ESPAÑ
- Page 151 and 152:
El Boletín Oficial de Castilla y L
- Page 153 and 154:
Obtentor de patata de siembra, uno
- Page 155 and 156:
TABLA 11.4: SUPERFICIE CULTIVADA, P
- Page 157 and 158:
esa producción con lo que los mult
- Page 159 and 160:
las producciones de semilla; pero a
- Page 161 and 162:
GRÁFICO 11.7 DESTINO DE LAS PRODUC
- Page 163 and 164:
11.10.1 NECESIDADES DE SEMILLA EN C
- Page 165 and 166:
o “No se pueden multiplicar varie
- Page 167 and 168:
para su análisis de las bacterias
- Page 169 and 170:
ENSAYO COMPARATIVO DE PRODUCCIÓN E
- Page 171 and 172:
VARIEDAD Nº LOTES IMPORTADO PRODUC
- Page 173 and 174:
ALMACENAMIENTO EN ALMACEN (TOTAL) E
- Page 175 and 176:
Bélgica, y es destacable su gran p
- Page 177 and 178:
12.1.3 COMERCIALIZACIÓN EN FRANCIA
- Page 179 and 180:
UE se puede observar que Israel y M
- Page 181 and 182:
Sin embargo, esta normativa no esta
- Page 183 and 184:
12.1.4.2. GNIS (Groupement National
- Page 185 and 186:
• Relación interprofesional entr
- Page 187 and 188:
• El objetivo de las acciones de
- Page 189 and 190:
acordes con los requisitos del merc
- Page 191 and 192:
En el caso de las producciones, las
- Page 193 and 194:
Gracias al aumento de los rendimien
- Page 195 and 196:
Como se puede observar, hay una rel
- Page 197 and 198:
La financiación, tal y como se ha
- Page 199 and 200:
Los cultivos que componen las rotac
- Page 201 and 202:
Como aspectos importantes a destaca
- Page 203 and 204:
Como aspectos importantes aclarator
- Page 205 and 206:
precio adecuado para poder consumir
- Page 207 and 208:
egiones del país y está asociada
- Page 209 and 210:
Sus importaciones han fluctuado a l
- Page 211 and 212:
En la siguiente tabla se observa cu
- Page 213 and 214:
fomento de la Innovación Tecnológ
- Page 215 and 216:
13.3 NEIKER-TECNALIA (Instituto Vas
- Page 217 and 218:
B) Diseño de modelos de producció
- Page 219 and 220:
13.4.8 UNIVERSIDAD DE SANTIAGO DE C
- Page 221 and 222:
En el futuro podrían salir nuevas
- Page 223 and 224:
14.2 CENTRO REGIONAL DE DIAGNÓSTIC
- Page 225 and 226:
A continuación se pasa a describir
- Page 227 and 228:
14.3.2 EVALUAR LA VIABILIDAD DE LA
- Page 229 and 230:
Durante este procesado, debido a la
- Page 231 and 232:
de acrilamida tras un procesado tec
- Page 233 and 234:
14.4.2 OBJETIVOS ESTRATÉGICOS Y JU
- Page 235 and 236:
sistemas de producción sostenibles
- Page 237 and 238:
capacidad de almacenar los clones d
- Page 239 and 240:
En España en general, y en Castill
- Page 241 and 242:
patatas. Se recomienda ingerir diar
- Page 243 and 244:
240
- Page 245 and 246:
DEBILIDADES AMENAZAS D1.- Escaso gr
- Page 247 and 248:
FORTALEZAS OPORTUNIDADES PRODUCCIÓ
- Page 249 and 250:
246
- Page 251 and 252:
EJE ESTRATÉGICO 1:AGENTES DEL SECT
- Page 253 and 254:
EJE ESTRATÉGICO 3: CONTROL DE LA P
- Page 255 and 256:
EJE ESTRATÉGICO 5: COMERCIALIZACI
- Page 257 and 258:
254
- Page 259 and 260:
ANTIGÜEDAD DE LOS PRODUCTORES DE P
- Page 261 and 262:
PROVINCIA: SORIA RANGOS Nº % MENOS
- Page 263 and 264:
Por provincias la distribución de
- Page 265 and 266:
VARIEDADES DE PATATA CULTIVADAS EN
- Page 267 and 268:
Observando esta tabla, se puede dec
- Page 269 and 270:
El desglose por Cooperativas y prov
- Page 271 and 272:
VENTA DE PATATA EN CASTILLA Y LEÓN
- Page 273 and 274:
11. SUSCRIPCION DE CONTRATOS CASTI
- Page 275 and 276:
13. TENENCIA DE ALMACENES Los resul
- Page 277 and 278:
Controlar la superficie a sembrar,
- Page 279 and 280:
2. CAPACIDAD DE ALMACENAMIENTO POR
- Page 281 and 282:
En las APP existen 4 que declaran u
- Page 283 and 284:
CUATRO MESES SEPTIEMBRE-DICIEMBRE O
- Page 285 and 286:
Para las APP, los medios humanos qu
- Page 287 and 288:
Las APP tienen menos vocación de c
- Page 289 and 290:
Análisis del consumo. TNS, MERCASA
- Page 291 and 292:
TABLA 3.9. SUPERFICIE Y PRODUCCIÓN
- Page 293 and 294:
GRÁFICO 8.8. PRECIOS MEDIOS DE PAT