Partie 2: Rapport d'activité - Mobistar
Partie 2: Rapport d'activité - Mobistar
Partie 2: Rapport d'activité - Mobistar

Create successful ePaper yourself
Turn your PDF publications into a flip-book with our unique Google optimized e-Paper software.
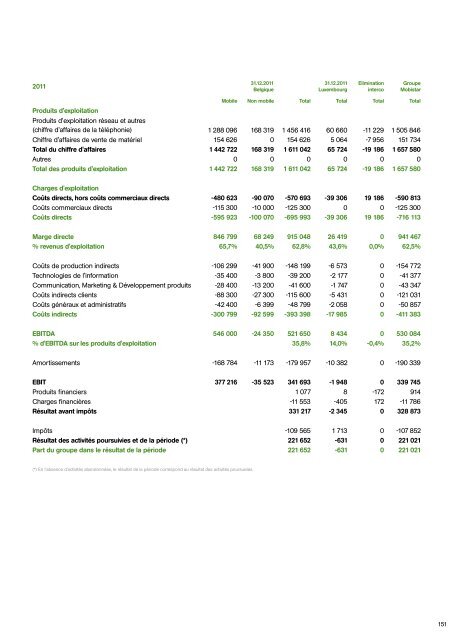
2011<br />
Produits d'exploitation<br />
31.12.2011<br />
Belgique<br />
31.12.2011<br />
Luxembourg<br />
Elimination<br />
interco<br />
Groupe<br />
<strong>Mobistar</strong><br />
Mobile Non mobile Total Total Total Total<br />
Produits d'exploitation réseau et autres<br />
(chiffre d'affaires de la téléphonie) 1 288 096 168 319 1 456 416 60 660 -11 229 1 505 846<br />
Chiffre d'affaires de vente de matériel 154 626 0 154 626 5 064 -7 956 151 734<br />
Total du chiffre d'affaires 1 442 722 168 319 1 611 042 65 724 -19 186 1 657 580<br />
Autres 0 0 0 0 0 0<br />
Total des produits d'exploitation 1 442 722 168 319 1 611 042 65 724 -19 186 1 657 580<br />
Charges d'exploitation<br />
Coûts directs, hors coûts commerciaux directs -480 623 -90 070 -570 693 -39 306 19 186 -590 813<br />
Coûts commerciaux directs -115 300 -10 000 -125 300 0 0 -125 300<br />
Coûts directs -595 923 -100 070 -695 993 -39 306 19 186 -716 113<br />
Marge directe 846 799 68 249 915 048 26 419 0 941 467<br />
% revenus d'exploitation 65,7% 40,5% 62,8% 43,6% 0,0% 62,5%<br />
Coûts de production indirects -106 299 -41 900 -148 199 -6 573 0 -154 772<br />
Technologies de l'information -35 400 -3 800 -39 200 -2 177 0 -41 377<br />
Communication, Marketing & Développement produits -28 400 -13 200 -41 600 -1 747 0 -43 347<br />
Coûts indirects clients -88 300 -27 300 -115 600 -5 431 0 -121 031<br />
Coûts généraux et administratifs -42 400 -6 399 -48 799 -2 058 0 -50 857<br />
Coûts indirects -300 799 -92 599 -393 398 -17 985 0 -411 383<br />
EBITDA 546 000 -24 350 521 650 8 434 0 530 084<br />
% d'EBITDA sur les produits d'exploitation 35,8% 14,0% -0,4% 35,2%<br />
Amortissements -168 784 -11 173 -179 957 -10 382 0 -190 339<br />
EBIT 377 216 -35 523 341 693 -1 948 0 339 745<br />
Produits financiers 1 077 8 -172 914<br />
Charges financières -11 553 -405 172 -11 786<br />
Résultat avant impôts 331 217 -2 345 0 328 873<br />
Impôts -109 565 1 713 0 -107 852<br />
Résultat des activités poursuivies et de la période (*) 221 652 -631 0 221 021<br />
Part du groupe dans le résultat de la période 221 652 -631 0 221 021<br />
(*) En l’absence d’activités abandonnées, le résultat de la période correspond au résultat des activités poursuivies.<br />
151