Le rapport - Office International de l'Eau
Le rapport - Office International de l'Eau
Le rapport - Office International de l'Eau
Create successful ePaper yourself
Turn your PDF publications into a flip-book with our unique Google optimized e-Paper software.
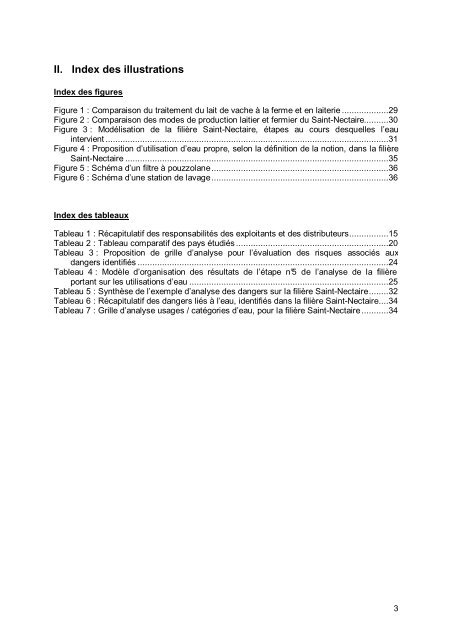
II. In<strong>de</strong>x <strong>de</strong>s illustrations<br />
In<strong>de</strong>x <strong>de</strong>s figures<br />
Figure 1 : Comparaison du traitement du lait <strong>de</strong> vache à la ferme et en laiterie ...................29<br />
Figure 2 : Comparaison <strong>de</strong>s mo<strong>de</strong>s <strong>de</strong> production laitier et fermier du Saint-Nectaire..........30<br />
Figure 3 : Modélisation <strong>de</strong> la filière Saint-Nectaire, étapes au cours <strong>de</strong>squelles l’eau<br />
intervient ...................................................................................................................31<br />
Figure 4 : Proposition d’utilisation d’eau propre, selon la définition <strong>de</strong> la notion, dans la filière<br />
Saint-Nectaire ...........................................................................................................35<br />
Figure 5 : Schéma d’un filtre à pouzzolane........................................................................36<br />
Figure 6 : Schéma d’une station <strong>de</strong> lavage........................................................................36<br />
In<strong>de</strong>x <strong>de</strong>s tableaux<br />
Tableau 1 : Récapitulatif <strong>de</strong>s responsabilités <strong>de</strong>s exploitants et <strong>de</strong>s distributeurs................15<br />
Tableau 2 : Tableau comparatif <strong>de</strong>s pays étudiés ..............................................................20<br />
Tableau 3 : Proposition <strong>de</strong> grille d’analyse pour l’évaluation <strong>de</strong>s risques associés aux<br />
dangers i<strong>de</strong>ntifiés ......................................................................................................24<br />
Tableau 4 : Modèle d’organisation <strong>de</strong>s résultats <strong>de</strong> l’étape n°5 <strong>de</strong> l’analyse <strong>de</strong> la filière<br />
portant sur les utilisations d’eau .................................................................................25<br />
Tableau 5 : Synthèse <strong>de</strong> l’exemple d’analyse <strong>de</strong>s dangers sur la filière Saint-Nectaire........32<br />
Tableau 6 : Récapitulatif <strong>de</strong>s dangers liés à l’eau, i<strong>de</strong>ntifiés dans la filière Saint-Nectaire....34<br />
Tableau 7 : Grille d’analyse usages / catégories d’eau, pour la filière Saint-Nectaire...........34<br />
3


