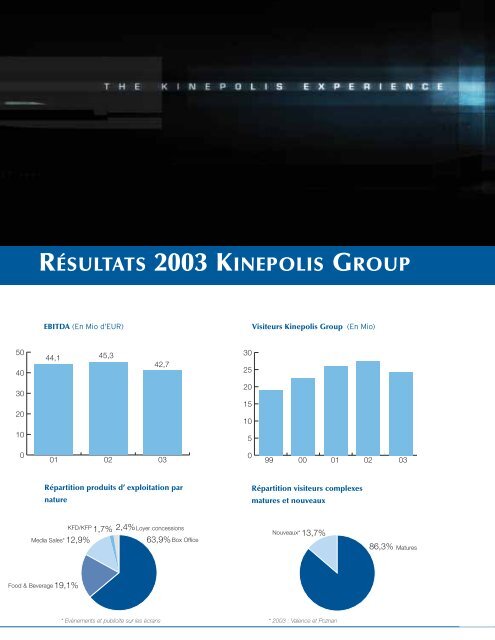
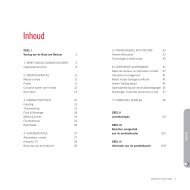
RÉSULTATS 2003 KINEPOLIS GROUP EBITDA (En Mio d’EUR) Visiteurs <strong>Kinepolis</strong> <strong>Group</strong> (En Mio) 50 40 44,1 45,3 42,7 30 25 30 20 20 15 10 10 5 0 01 02 03 0 99 00 01 02 03 Répartition produits d’ exploitation par nature Répartition visiteurs complexes matures et nouveaux Media Sales* KFD/KFP 1,7% 2,4% 12,9% Loyer concessions 63,9% Box Office Nouveaux* 13,7% 86,3% Matures Food & Beverage 19,1% * Evénements et publicite sur les écrans * 2003 : Valence et Poznan 8
CHIFFRES CLÉS CONSOLIDÉS 2003 (En '000 d'Eur) Croissance 31/12/03 31/12/02 Nombre de visiteurs (en '000) -11,4% 24 219 27 334 Produits d'Exploitation -7,2% 198 072 213 474 Produits d'Exploitation Decatron 1 673 3 436 Produits d'Exploitation excl. Decatron -6,5% 196 399 210 038 Chiffre d'affaires -7,6% 191 445 207 176 Chiffre d'affaires cinéma (1) -7,8% 186 869 202 750 Chiffre d'affaires autres activités (1) 3,4% 4 577 4 426 EBITDA -5,7% 42 729 45 310 Marge EBITDA / Produits d'Exploitation 21,57% 21,23% EBITDA excl. Decatron -4,3% 42 350 44 257 Marge EBITDA / Produits d'Exploitation excl. Decatron 21,56% 21,07% Amortissements, réductions de valeur et provisions (2) -18,2% 28 288 34 586 EBIT 34,7% 14 440 10 723 Marge EBIT / Produits d'Exploitation 7,29% 5,02% EBIT excl. Decatron 14 474 10 311 Marge EBIT / Produits d'Exploitation excl. Decatron 7,37% 4,91% Résultat d'Exploitation 14 440 10 723 Résultat financier (3) 35,0% -10 817 -16 635 Résultat courant 161,3% 3 624 -5 911 Résultat exceptionnel (4) -27,5% 2 205 3 041 Résultat avant impôts 303,1% 5 829 -2 870 Impôts et impôts différés 24,8% -3 736 -4 969 Quote-part dans le résultat des entreprises mises en équivalence 0 70 Résultat net consolidé 126,9% 2 093 -7 770 Résultat net consolidé du <strong>Group</strong>e 147,3% 2 719 -5 745 Part des tiers (5) -626 -2 025 Résultat net consolidé du <strong>Group</strong>e avant impôts 7 359 162 Résultat courant du groupe 175,9% 3 608 -4 756 Résultat net courant avant impôts 142,2% 2 985 -7 066 Amortissements goodwill 2 838 2 473 Résultat courant par action 0,52 -0,85 Résultat net du groupe par action 0,39 -0,83 Résultat net courant par action 142,2% 0,43 -1,02 Nombre d'actions 6 930 778 6 930 778 Actifs immobilisés et frais d'établissement 2 703 3 307 Goodwill 19 680 16 515 Immobilisations corporelles 240 391 260 325 Immobilisations financières 575 424 Créances à plus d'un an 21 041 24 205 Stocks et commandes en cours d'exécution 2 078 1 717 Créances commerciales 13 624 13 562 Autres créances 13 533 18 455 Placements de trésorerie et valeurs disponibles 14 250 13 163 Comptes de régularisation 1 335 6 554 ACTIF 329 210 358 227 Capitaux propres 61 395 62 172 Parts des tiers 528 2 361 Provisions et latences fiscales 10 092 10 272 Dettes à plus d'un an 139 247 160 383 Dettes à moins d'un an 33 492 56 915 Dettes commerciales 36 842 37 059 Autres dettes 29 625 14 522 Comptes de régularisation 17 988 14 542 PASSIF 329 210 358 227 (1) Le chiffre d’affaires des autres activités comprend principalement la distribution de films (KFD), la production de films et le chiffre d’affaires de projets. Les revenus de partenariats, présenté en 2002 comme ventes et prestations des holdings, et autres résultats des holdings sont présentés comme chiffre d’affaires provenant des activités cinéma. (2) Par rapport à 2002, on a comptabilisé en 2003, une baisse de 5,0 millions d’EUR net d’amortissements, dont 2,5 millions attribuable aux déconsolidations. La provision de 0,9 million d’EUR constitué suite à la plainte déposée par une entreprise en Pologne à fait l’objet d’une reprise intégrale (frais en 2002) ; les autres provisions ont augmentées par rapport à 2002 de 0,2 millions d’EUR. (3) Le résultat financier 2003 est de 1,6 millions d’EUR inclus, 2002 3,0 millions d’EUR inclus des pertes de change et la couverture de change (4) Résultat exceptionnel 2003 se rapporte principalement au plus-values réalisées sur les cessions de participations dans Cinecity Treviso et RMBe. (5) Parts de tiers 2002 se constitue de -0,19 mio d’EUR Treviso (Italie) et -1,83 mio d’EUR Poznan (Pologne) Parts de tiers 2003 se constitue de -0,04 mio d’EUR Treviso (Italie), -0,59 Mio d’EUR Poznan (Pologne) et 0,01 Mio d’EUR Nîmes (France) <strong>Rapport</strong> <strong>annuel</strong> 2003 9