La spesa pubblica locale

You also want an ePaper? Increase the reach of your titles
YUMPU automatically turns print PDFs into web optimized ePapers that Google loves.
<strong>La</strong> <strong>spesa</strong> <strong>pubblica</strong> <strong>locale</strong><br />
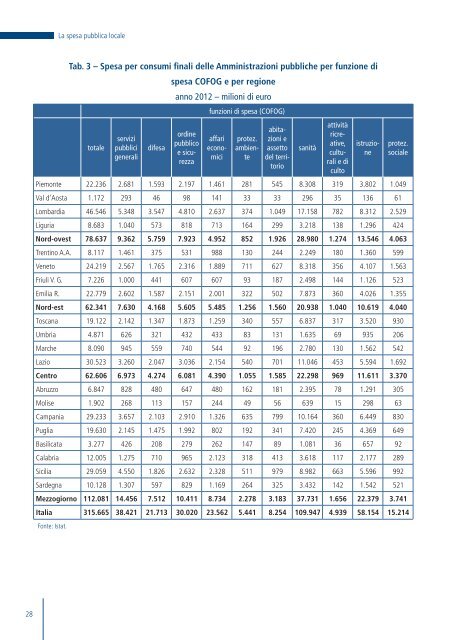
Tab. 3 – Spesa per consumi finali delle Amministrazioni pubbliche per funzione di<br />
totale<br />
servizi<br />
pubblici<br />
generali<br />
difesa<br />
<strong>spesa</strong> COFOG e per regione<br />
anno 2012 – milioni di euro<br />
ordine<br />
pubblico<br />
e sicurezza<br />
funzioni di <strong>spesa</strong> (COFOG)<br />
affari<br />
economici<br />
protez.<br />
ambiente<br />
abitazioni<br />
e<br />
assetto<br />
del territorio<br />
sanità<br />
attività<br />
ricreative,<br />
culturali<br />
e di<br />
culto<br />
istruzione<br />
protez.<br />
sociale<br />
Piemonte 22.236 2.681 1.593 2.197 1.461 281 545 8.308 319 3.802 1.049<br />
Val d'Aosta 1.172 293 46 98 141 33 33 296 35 136 61<br />
Lombardia 46.546 5.348 3.547 4.810 2.637 374 1.049 17.158 782 8.312 2.529<br />
Liguria 8.683 1.040 573 818 713 164 299 3.218 138 1.296 424<br />
Nord-ovest 78.637 9.362 5.759 7.923 4.952 852 1.926 28.980 1.274 13.546 4.063<br />
Trentino A.A. 8.117 1.461 375 531 988 130 244 2.249 180 1.360 599<br />
Veneto 24.219 2.567 1.765 2.316 1.889 711 627 8.318 356 4.107 1.563<br />
Friuli V. G. 7.226 1.000 441 607 607 93 187 2.498 144 1.126 523<br />
Emilia R. 22.779 2.602 1.587 2.151 2.001 322 502 7.873 360 4.026 1.355<br />
Nord-est 62.341 7.630 4.168 5.605 5.485 1.256 1.560 20.938 1.040 10.619 4.040<br />
Toscana 19.122 2.142 1.347 1.873 1.259 340 557 6.837 317 3.520 930<br />
Umbria 4.871 626 321 432 433 83 131 1.635 69 935 206<br />
Marche 8.090 945 559 740 544 92 196 2.780 130 1.562 542<br />
<strong>La</strong>zio 30.523 3.260 2.047 3.036 2.154 540 701 11.046 453 5.594 1.692<br />
Centro 62.606 6.973 4.274 6.081 4.390 1.055 1.585 22.298 969 11.611 3.370<br />
Abruzzo 6.847 828 480 647 480 162 181 2.395 78 1.291 305<br />
Molise 1.902 268 113 157 244 49 56 639 15 298 63<br />
Campania 29.233 3.657 2.103 2.910 1.326 635 799 10.164 360 6.449 830<br />
Puglia 19.630 2.145 1.475 1.992 802 192 341 7.420 245 4.369 649<br />
Basilicata 3.277 426 208 279 262 147 89 1.081 36 657 92<br />
Calabria 12.005 1.275 710 965 2.123 318 413 3.618 117 2.177 289<br />
Sicilia 29.059 4.550 1.826 2.632 2.328 511 979 8.982 663 5.596 992<br />
Sardegna 10.128 1.307 597 829 1.169 264 325 3.432 142 1.542 521<br />
Mezzogiorno 112.081 14.456 7.512 10.411 8.734 2.278 3.183 37.731 1.656 22.379 3.741<br />
Italia 315.665 38.421 21.713 30.020 23.562 5.441 8.254 109.947 4.939 58.154 15.214<br />
Fonte: Istat.<br />
28