La spesa pubblica locale

You also want an ePaper? Increase the reach of your titles
YUMPU automatically turns print PDFs into web optimized ePapers that Google loves.
1. Alcune considerazioni sulla <strong>spesa</strong> <strong>pubblica</strong><br />
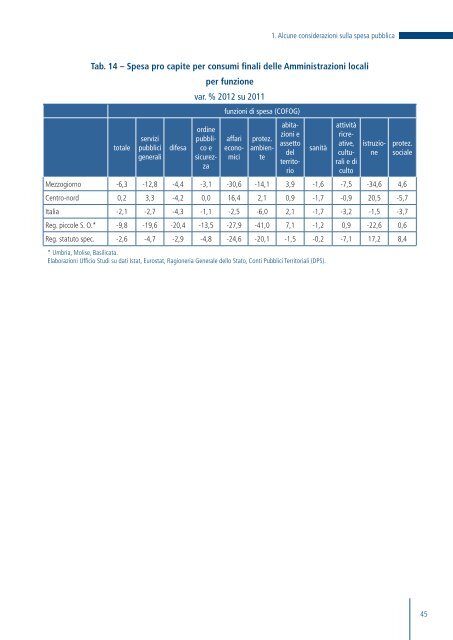
Tab. 14 – Spesa pro capite per consumi finali delle Amministrazioni locali<br />
totale<br />
servizi<br />
pubblici<br />
generali<br />
difesa<br />
per funzione<br />
var. % 2012 su 2011<br />
ordine<br />
pubblico<br />
e<br />
sicurezza<br />
funzioni di <strong>spesa</strong> (COFOG)<br />
affari<br />
economici<br />
protez.<br />
ambiente<br />
abitazioni<br />
e<br />
assetto<br />
del<br />
territorio<br />
sanità<br />
attività<br />
ricreative,<br />
culturali<br />
e di<br />
culto<br />
istruzione<br />
Mezzogiorno -6,3 -12,8 -4,4 -3,1 -30,6 -14,1 3,9 -1,6 -7,5 -34,6 4,6<br />
Centro-nord 0,2 3,3 -4,2 0,0 16,4 2,1 0,9 -1,7 -0,9 20,5 -5,7<br />
Italia -2,1 -2,7 -4,3 -1,1 -2,5 -6,0 2,1 -1,7 -3,2 -1,5 -3,7<br />
Reg. piccole S. O.* -9,8 -19,6 -20,4 -13,5 -27,9 -41,0 7,1 -1,2 0,9 -22,6 0,6<br />
Reg. statuto spec. -2,6 -4,7 -2,9 -4,8 -24,6 -20,1 -1,5 -0,2 -7,1 17,2 8,4<br />
* Umbria, Molise, Basilicata.<br />
Elaborazioni Ufficio Studi su dati Istat, Eurostat, Ragioneria Generale dello Stato, Conti Pubblici Territoriali (DPS).<br />
protez.<br />
sociale<br />
45