- Page 2 and 3:
con il patrocinio delMinistero dell
- Page 4 and 5:
PRESENTAZIONENell’ambito delle at
- Page 6 and 7:
PREMESSASi calcola che circa il 75%
- Page 8 and 9:
CONTRIBUTI E RINGRAZIAMENTIIl Rappo
- Page 10:
Stefania BARLETTI, Fabrizio FELICI,
- Page 13 and 14:
207 Qualità dell'ariaR. Aceto, S.
- Page 15 and 16:
I risultati del lavoro si traducono
- Page 17 and 18:
ACQUE• I consumi di acqua per uso
- Page 19 and 20:
sibile valutare positivamente il mi
- Page 21 and 22:
8COMUNICAZIONE ED INFORMAZIONE• N
- Page 24 and 25:
IL PROCESSO DI COSTRUZIONE DEL RAPP
- Page 26 and 27:
I lavori del II Rapporto sono stati
- Page 28:
anni di rilevamento del dato, le di
- Page 31 and 32:
coprendo il 2,2% della superficie i
- Page 33 and 34:
segue Tabella 1: Popolazione reside
- Page 35 and 36:
22segue Tabella 2: Saldo naturale e
- Page 37 and 38:
Tabella 3: Densità della popolazio
- Page 39 and 40:
ConclusioniNell’ambito delle comp
- Page 41 and 42:
Le componenti del territorio comuna
- Page 43 and 44:
Tabella 1 - Classificazione dei liv
- Page 45 and 46:
Figura 1: - Ripartizione del grado
- Page 47 and 48:
Figura 2: Comune di Roma: l’immag
- Page 49 and 50:
Figura 4: Comune di Napoli: l’imm
- Page 52 and 53:
CONSUMO DI SUOLO (LAND TAKE)M. DI L
- Page 54 and 55:
Superficie urbanizzata (km 2 ) - va
- Page 56 and 57:
Grafico 1 - Uso dei suoli prima di
- Page 58 and 59:
segue Grafico 1 - Uso dei suoli pri
- Page 60 and 61:
Tabella 4 - Descrizioni delle class
- Page 62 and 63:
segue Grafico 2 - Ripartizione dei
- Page 64:
ConclusioniDall’analisi della var
- Page 67 and 68:
Il progetto che sta alla base degli
- Page 92 and 93:
I SITI CONTAMINATI DI INTERESSENAZI
- Page 94 and 95:
TorinoSIN:Basse di SturaSuperficie
- Page 96 and 97:
SIN:Cerro al LambroSuperficie total
- Page 98 and 99:
TriesteSIN:TriesteSuperficie totale
- Page 100 and 101:
AnconaSIN:Falconara MarittimaSuperf
- Page 102 and 103:
SIN: Napoli Bagnoli Coroglio *Super
- Page 104 and 105:
TarantoSIN:TarantoSuperficie totale
- Page 106 and 107:
STABILIMENTI A RISCHIO DI INCIDENTE
- Page 108 and 109:
Per avere indicazioni delle tendenz
- Page 110 and 111:
Tabella 2: Densità stabilimenti RI
- Page 112 and 113:
Tabella 4 Evoluzione negli anniN Co
- Page 114 and 115:
I RIFIUTI URBANIR. LARAIA, V. FRITT
- Page 116 and 117:
Tabella 1- Produzione dei rifiuti u
- Page 118 and 119:
La raccolta differenziataLa raccolt
- Page 120 and 121:
si colloca a circa 25 kg/abitante p
- Page 122 and 123:
segue Tabella 3 - Principali frazio
- Page 124 and 125:
Tabella 1 - Produzione di rifiuti u
- Page 126 and 127:
Per quanto riguarda le singole fraz
- Page 128 and 129:
EGUE Tabella 3 - Raccolta differenz
- Page 130 and 131:
Tabella 4 - Raccolta differenziata
- Page 132:
Più efficienti appaiono, in genera
- Page 135 and 136:
servizio pubblico locale si intende
- Page 137 and 138:
Gli indicatori sopra elencati sono
- Page 139 and 140:
Figura 1 - Percentuale di verde urb
- Page 141 and 142:
Analogamente a quanto riportato nel
- Page 143 and 144:
Variazioni anche significative risp
- Page 146 and 147:
LA BIODIVERSITÀ ANIMALEM. MIRABILE
- Page 148 and 149:
segue Tabella 1: atlanti (A), lavor
- Page 150 and 151:
provinciale molti lavori sono prece
- Page 152 and 153:
AostaMoltoni E., 1943. Gli uccelli
- Page 154 and 155:
M.A., Carpaneto G. M. & Cignini B.
- Page 156 and 157:
CONSUMI DI ACQUA PER USO DOMESTICOE
- Page 158 and 159:
Tab. 2 - Adozione di misure di razi
- Page 160 and 161:
a b3C o n s u m o m1009896949290888
- Page 162 and 163:
Consumo m 3 /ab90888684828078767472
- Page 164 and 165:
Consumo m 3 /ab80787674727068666462
- Page 166 and 167:
Consumo m 3 /ab80787674727068666462
- Page 168 and 169:
Consumo m 3 /ab80787674727068666462
- Page 170 and 171:
Consumo m 3 /ab70686664626058565452
- Page 172 and 173:
Consumo m 3 /ab80787674727068666462
- Page 174 and 175:
Consumo m 3 /ab80787674727068666462
- Page 176 and 177:
Perdite di reteNella gestione delle
- Page 178:
60Perdite di rete, ISTAT 19995040(%
- Page 181 and 182:
trattamento complementare rispetto
- Page 183 and 184:
segue Tab. 1: Carico nominale degli
- Page 185 and 186:
voluto fornire ai cittadini europei
- Page 187 and 188:
segue Tab. 3: Percentuale del caric
- Page 189 and 190:
segue Tab. 4 Percentuale del carico
- Page 191 and 192:
Nel caso di più impianti di depura
- Page 193 and 194:
180c. Per quanto attiene il rispett
- Page 195 and 196:
182Tabella 1: Balneabilità delle c
- Page 197 and 198:
ANALISI DEI DATIRiguardo alle defin
- Page 199 and 200:
Grafico 1 : % COSTA BALNEABILE RISP
- Page 201 and 202:
Grafico 3: % COSTA CONTROLLATA RISP
- Page 203 and 204:
ConclusioniL’analisi dei dati pre
- Page 205 and 206:
L’ulteriore grado di disaggregazi
- Page 207 and 208:
194Tabella 2: Emissioni comunali co
- Page 209 and 210:
Figura 3: Emissioni comunali di com
- Page 211 and 212:
Figura 4: Emissioni comunali di oss
- Page 213 and 214:
Figura 5: Emissioni comunali di mon
- Page 215 and 216:
Figura 7: Emissioni comunali di amm
- Page 218 and 219:
QUALITÀ DELL’ARIAR. ACETO, S. BA
- Page 220 and 221:
Tabella 1 - PM 10 (2007) - Numero m
- Page 222 and 223:
Per il PM 10 in figura 1 è rappres
- Page 224 and 225:
segue Tabella 2 - NO 2 (2007) - Num
- Page 226 and 227:
Tabella 3 - SO 2 (2007) - Numero ma
- Page 228 and 229:
I dati relativi all’SO 2 riportat
- Page 230 and 231:
I dati relativi al C 6 H 6 riportat
- Page 232 and 233:
Anche se gli indicatori relativi al
- Page 234 and 235:
CONTENIMENTO ENERGETICO IN EDILIZIA
- Page 236 and 237:
Fig. 3 Consumi di gas metano per us
- Page 238 and 239:
Fig. 6 Consumi di energia elettrica
- Page 240 and 241:
Fig. 8 Impianti fotovoltaici, suddi
- Page 242 and 243:
mance ambientale degli edifici e pe
- Page 244:
ConclusioniA seguito di normative e
- Page 247 and 248:
al trasporto tradizionale, oltre ch
- Page 249 and 250:
Figura 2: ripartizione percentuale
- Page 251 and 252:
navali e mirano a garantire una rid
- Page 253 and 254:
Figura 5: emissioni nazionali di SO
- Page 255 and 256:
primo porto tedesco ad applicare il
- Page 257 and 258:
Autovetture ogni 1000 abitantiL’i
- Page 259 and 260:
Tabella 2. Standard emissivi previs
- Page 261 and 262:
Percentuale di autovetture alimenta
- Page 263 and 264:
Figura 3: distribuzione percentuale
- Page 265 and 266:
Figura 5: Variazione percentuale de
- Page 267 and 268:
Figura 6: Numero di motocicli ogni
- Page 269 and 270:
Figura 7: Distribuzione percentuale
- Page 272 and 273:
LA MOBILITÀ URBANA SOSTENIBILER. B
- Page 274 and 275:
Tabella 1: Densità di piste ciclab
- Page 276 and 277:
Tabella 2: Utilizzo del trasporto p
- Page 278 and 279:
Tabella 3: Stalli di sosta a pagame
- Page 280 and 281:
Tabella 4: Estensione delle ztl (m
- Page 282 and 283:
Palermo si attestano interno al val
- Page 284 and 285: Tabella 6: Numero di stalli di sost
- Page 286: se. Ciò è particolarmente vero pe
- Page 289 and 290: 276Roma e Milano, dove le “distan
- Page 291 and 292: 278segue Tabella 1: Popolazione res
- Page 293 and 294: Figura 2: Distribuzione percentuale
- Page 295 and 296: 282segue Tabella 2:Popolazione resi
- Page 297 and 298: 284segue Tabella 3: Popolazione res
- Page 299 and 300: 286segue Tabella 3: Popolazione res
- Page 302 and 303: INQUINAMENTO ELETTROMAGNETICOS. CUR
- Page 304 and 305: Tabella 2 - Limiti di esposizione,
- Page 306 and 307: Dall’analisi dei dati disponibili
- Page 308 and 309: Dalla tabella 6 si evince che per g
- Page 310 and 311: INQUINAMENTO ACUSTICOS. CURCURUTO,
- Page 312 and 313: di descrittori acustici differenti,
- Page 314 and 315: Tabella 1. Dati relativi agli indic
- Page 316 and 317: 11Il Comune di Modena ha redatto le
- Page 318 and 319: Tabella. 2. Popolazione esposta al
- Page 320 and 321: 3periodo diurno: dalle 06.00 alle 2
- Page 322 and 323: IL TURISMO NELLE AREE URBANEG. FINO
- Page 324 and 325: Tabella 1: Infrastrutture turistich
- Page 326 and 327: Risultati più elevati si riscontra
- Page 328 and 329: segue Tabella 2: Infrastrutture tur
- Page 330 and 331: Tabella 3: Infrastrutture turistich
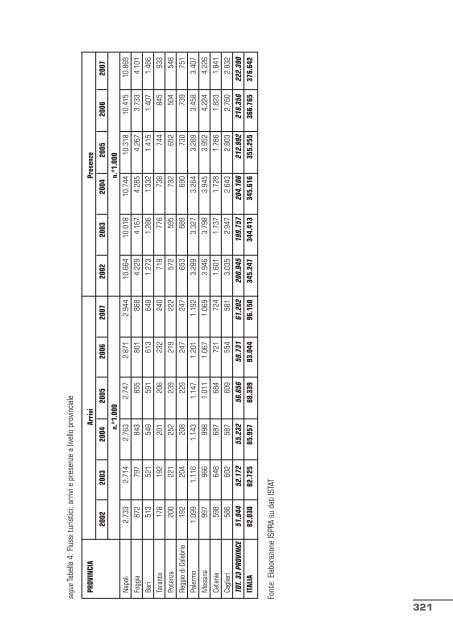
- Page 332 and 333: I flussi turistici a livello provin
- Page 336 and 337: Tabella 5: Flussi turistici: “pes
- Page 338 and 339: Per quanto riguarda la permanenza m
- Page 340 and 341: IL MARCHIO ECOLABEL EUROPEONEI SERV
- Page 342 and 343: Il marchio Ecolabel europeo nei ser
- Page 344 and 345: LA BANCA DATI GELSO COME SUPPORTOPE
- Page 346 and 347: Tabella 1 - Adesione ai principali
- Page 348 and 349: segue Tabella 2 - Rassegna degli st
- Page 350 and 351: segue Tabella 2 - Rassegna degli st
- Page 352 and 353: Figura 1 - Le buone pratiche inseri
- Page 354 and 355: segue Tabella 3 - Quadro di sintesi
- Page 356 and 357: segue Tabella 3 - Quadro di sintesi
- Page 358 and 359: segue Tabella 4 - Progetti monitora
- Page 360 and 361: SURVEY, CENSIMENTO E MONITORAGGIO S
- Page 362 and 363: processi di sostenibilità urbana,
- Page 364 and 365: Tabella 1 - Le città analizzate in
- Page 366 and 367: Figura 3 - Timeline dei processi di
- Page 368 and 369: Figura 7 - Le tematiche legate ai 1
- Page 370 and 371: Le tematiche prevalenti nei process
- Page 372 and 373: Figura 12 - Città che hanno attiva
- Page 374 and 375: Città di PalermoLa Città di Paler
- Page 376 and 377: Città di PadovaIl Comune di Padova
- Page 378 and 379: Città di FoggiaIl Comune di Foggia
- Page 380: Una lettura in tal senso è anche q
- Page 383 and 384: zioni ai temi ambientali. Si intend
- Page 385 and 386:
Figura 1: Andamento dell’indice S
- Page 387 and 388:
Figura 2: Andamento degli indici
- Page 389 and 390:
Le banche dati ambientali fanno un
- Page 391 and 392:
Reggio Calabria e Messina occupano
- Page 393 and 394:
AppendiceNota metodologica: Dal SIC
- Page 395 and 396:
Tempo di rilevamentoDicembre 2008Ca
- Page 398 and 399:
CONSIDERAZIONI CONCLUSIVEA CURA DI
- Page 400:
l’estensione di una pista ciclabi