Caracterização de produtos panificados à base de féculas
Caracterização de produtos panificados à base de féculas
Caracterização de produtos panificados à base de féculas

You also want an ePaper? Increase the reach of your titles
YUMPU automatically turns print PDFs into web optimized ePapers that Google loves.
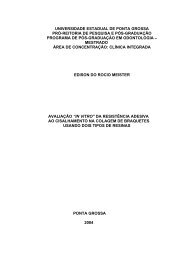
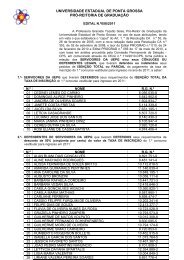
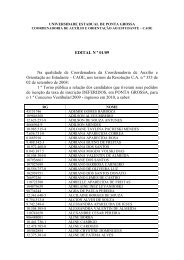
Milhões <strong>de</strong> toneladas<br />
700<br />
600<br />
500<br />
400<br />
300<br />
200<br />
100<br />
0<br />
1990 1991 1992 1993 1994 1995 1996 1997 1998 1999 2000 2001 2002 2003 2004<br />
Anos<br />
Figura 2 - Produção anual <strong>de</strong> fécula <strong>de</strong> mandioca no Brasil em milhões <strong>de</strong> toneladas.<br />
FONTE: ABAM, 2005.<br />
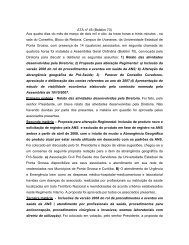
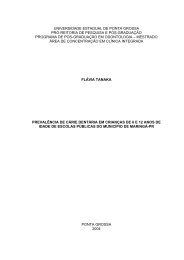
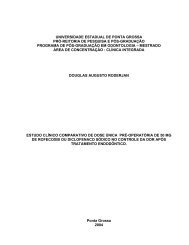
Com relação aos custos <strong>de</strong> produção da fécula, em 2002, po<strong>de</strong>-se consi<strong>de</strong>rar a<br />
matéria-prima como o custo mais representativo (52%), seguido <strong>de</strong> 18% <strong>de</strong> <strong>de</strong>spesas<br />
financeiras, 11% <strong>de</strong> impostos, 7% <strong>de</strong> salários e o restante <strong>de</strong> custos relacionados a<br />
manutenção, embalagem, lenha e energia (CEREDA; VILPOUX, 2003). A Figura 3 ilustra<br />
essa situação.<br />
Salários; 7%<br />
Impostos; 11%<br />
Outros; 12%<br />
Juros; 18%<br />
Figura 3 - Custos <strong>de</strong> produção da fécula em 2002.<br />
FONTE: CEREDA; VILPOUX, 2003.<br />
Matéria-prima;<br />
52%<br />
Easy PDF Creator is professional software to create PDF. If you wish to remove this line, buy it now.<br />
24