PTB-Jahresbericht 2005
PTB-Jahresbericht 2005
PTB-Jahresbericht 2005

Sie wollen auch ein ePaper? Erhöhen Sie die Reichweite Ihrer Titel.
YUMPU macht aus Druck-PDFs automatisch weboptimierte ePaper, die Google liebt.
Figures and facts<br />
Zahlen und<br />
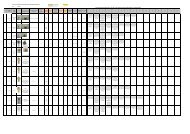
Personal: Entwicklung • Staff: development<br />
Personelle Entwicklung von 1996 bis <strong>2005</strong> (Stand: 31. Dezember <strong>2005</strong>) • Development of staff<br />
a) unbefristet • unlimited in time b) zeitlich befristet • limited in time<br />
Beschäftigungsverhältnis<br />
a)<br />
1996 1997 1998 1999 2000 2001 2002 2003 2004 <strong>2005</strong><br />
Beamte • civil servants 483 483 486 490 501 503 507 506 508 510<br />
Angestellte • employees 869 850 827 821 808 786 767 744 727 692<br />
Arbeiter • workers 242 234 227 223 201 204 201 201 193 196<br />
Kasinopersonal • canteen staff 8 8 8 6 6 7 7 6 0 0<br />
gesamt • total<br />
b)<br />
1602 1575 1548 1540 1516 1500 1482 1457 1428 1398<br />
Auszubildende • trainees 133 142 150 151 147 136 138 144 158 159<br />
Aushilfskräfte<br />
temporary staff<br />
16 19 35 32 44 52 53 52 61 69<br />
Drittmittelpersonal<br />
staff members financed by<br />
third parties<br />
104 85 110 70 92 104 106 122 105 109<br />
Mitarbeiter gesamt<br />
staff member total<br />
1855 1821 1843 1793 1799 1792 1779 1775 1752 1735<br />
Anzahl • number<br />
Personal: Altersstruktur • Staff: age structure<br />
400<br />
350<br />
300<br />
250<br />
200<br />
150<br />
100<br />
50<br />
0<br />
bis 25 26–30 31–35 36–40 41–45 46–50 51–55 56–60 61–65<br />
Altersgruppe • age group<br />
Höherer Dienst<br />
Higher service<br />
Gehobener Dienst<br />
Higher intermediate<br />
service<br />
36<br />
Mittl./Einf. D.<br />
Intermediate/<br />
lower service<br />
Arbeiter<br />
Workers<br />
Altersstruktur der Mitarbeiter/innenunterschieden<br />
nach Laufbahngruppen<br />
(ohne Auszubildende)<br />
Age structure of staff<br />
distinguished by civil<br />
service groups (not<br />
including trainees)