Monatsbericht Oktober 2013
Monatsbericht Oktober 2013
Monatsbericht Oktober 2013

Erfolgreiche ePaper selbst erstellen
Machen Sie aus Ihren PDF Publikationen ein blätterbares Flipbook mit unserer einzigartigen Google optimierten e-Paper Software.
Deutsche Bundesbank<br />
<strong>Monatsbericht</strong><br />
<strong>Oktober</strong> <strong>2013</strong><br />
7<br />
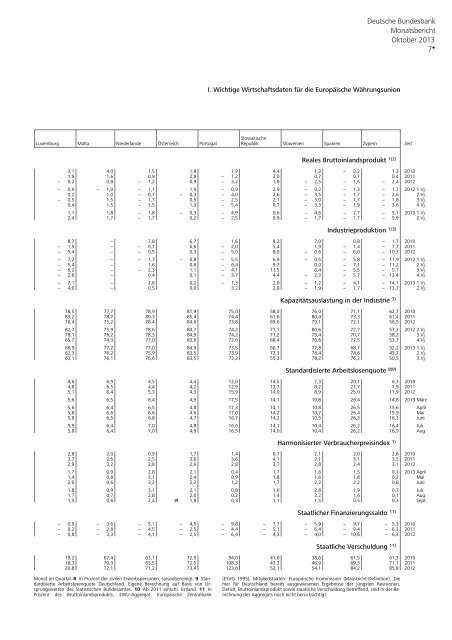
I. Wichtige Wirtschaftsdaten für die Europäische Währungsunion<br />
Slowakische<br />
Luxemburg Malta Niederlande Österreich Portugal Republik Slowenien Spanien Zypern Zeit<br />
Reales Bruttoinlandsprodukt 1)2)<br />
3,1 4,0 1,5 1,8 1,9 4,4 1,3 − 0,2 1,3 2010<br />
1,9 1,6 0,9 2,8 − 1,2 3,0 0,7 0,1 0,4 2011<br />
− 0,2 0,8 − 1,2 0,9 − 3,2 1,8 − 2,5 − 1,6 − 2,4 2012<br />
− 0,9 − 1,0 − 1,1 1,9 − 0,9 2,9 − 0,2 − 1,3 − 1,7 2012 1.Vj.<br />
0,2 1,0 − 0,7 − 0,3 − 4,0 2,6 − 3,5 − 1,7 − 2,6 2.Vj.<br />
− 0,5 1,5 − 1,7 0,5 − 2,5 2,1 − 3,0 − 1,7 − 1,8 3.Vj.<br />
0,4 1,5 − 1,5 1,3 − 5,4 0,7 − 3,3 − 1,9 − 3,6 4.Vj.<br />
1,1 1,8 − 1,8 − 0,3 − 4,9 0,6 − 4,6 − 2,7 − 5,1 <strong>2013</strong> 1.Vj.<br />
2,4 1,7 − 1,7 0,2 − 2,5 0,9 − 1,7 − 1,7 − 5,9 2.Vj.<br />
Industrieproduktion 1)3)<br />
8,7 − 7,8 6,7 1,6 8,2 7,0 0,8 − 1,7 2010<br />
− 1,9 − − 0,7 6,6 − 2,0 5,4 1,9 − 1,4 − 7,7 2011<br />
− 5,4 − − 0,5 0,3 − 5,0 8,0 − 0,6 − 6,0 − 10,3 2012<br />
− 7,2 − − 1,7 − 0,8 − 5,5 6,9 − 0,5 − 5,8 − 11,9 2012 1.Vj.<br />
− 5,4 − 1,6 0,8 − 6,4 9,7 0,0 − 7,1 − 11,2 2.Vj.<br />
− 6,2 − − 2,3 1,1 − 4,1 11,5 0,4 − 5,5 − 5,7 3.Vj.<br />
− 2,8 − 0,4 0,1 − 3,7 4,4 − 2,3 − 5,7 − 12,4 4.Vj.<br />
− 7,1 − 2,6 0,2 − 1,3 2,6 − 1,2 − 4,1 − 14,1 <strong>2013</strong> 1.Vj.<br />
− 4,0 − 0,5 0,0 3,2 2,8 − 1,9 − 1,7 − 13,7 2.Vj.<br />
Kapazitätsauslastung in der Industrie 7)<br />
78,5 77,7 78,9 81,9 75,0 58,0 76,0 71,1 62,7 2010<br />
83,2 78,7 80,3 85,4 74,4 61,6 80,4 73,3 61,4 2011<br />
76,4 75,2 78,4 84,6 73,8 69,6 79,1 72,1 56,5 2012<br />
82,7 75,9 78,6 84,7 74,2 71,1 80,6 72,7 57,2 2012 2.Vj.<br />
78,1 76,2 78,3 84,9 74,2 71,2 79,4 70,7 58,2 3.Vj.<br />
65,7 74,3 77,0 83,6 72,6 68,4 76,6 72,5 53,7 4.Vj.<br />
66,9 77,2 77,0 84,9 73,5 60,7 77,8 68,7 52,2 <strong>2013</strong> 1.Vj.<br />
62,3 76,2 75,9 83,5 73,9 72,3 78,4 74,6 43,7 2.Vj.<br />
63,1 76,1 76,6 83,5 73,2 55,2 78,2 76,2 50,5 3.Vj.<br />
Standardisierte Arbeitslosenquote 8)9)<br />
4,6 6,9 4,5 4,4 12,0 14,5 7,3 20,1 6,3 2010<br />
4,8 6,5 4,4 4,2 12,9 13,7 8,2 21,7 7,9 2011<br />
5,1 6,4 5,3 4,3 15,9 14,0 8,9 25,0 11,9 2012<br />
5,6 6,5 6,4 4,9 17,5 14,1 10,8 26,4 14,8 <strong>2013</strong> März<br />
5,6 6,4 6,5 4,8 17,3 14,1 10,8 26,5 15,6 April<br />
5,8 6,6 6,6 4,6 17,0 14,2 10,7 26,4 15,9 Mai<br />
5,8 6,5 6,8 4,7 16,7 14,2 10,5 26,3 16,3 Juni<br />
5,9 6,4 7,0 4,8 16,6 14,1 10,4 26,2 16,4 Juli<br />
5,8 6,4 7,0 4,9 16,5 14,0 10,4 26,2 16,9 Aug.<br />
Harmonisierter Verbraucherpreisindex 1)<br />
2,8 2,0 0,9 1,7 1,4 0,7 2,1 2,0 2,6 2010<br />
3,7 2,5 2,5 3,6 3,6 4,1 2,1 3,1 3,5 2011<br />
2,9 3,2 2,8 2,6 2,8 3,7 2,8 2,4 3,1 2012<br />
1,7 0,9 2,8 2,1 0,4 1,7 1,6 1,5 0,1 <strong>2013</strong> April<br />
1,4 0,8 3,1 2,4 0,9 1,8 1,6 1,8 0,2 Mai<br />
2,0 0,6 3,2 2,2 1,2 1,7 2,2 2,2 0,8 Juni<br />
1,8 0,9 3,1 2,1 0,8 1,6 2,8 1,9 0,7 Juli<br />
1,7 0,7 2,8 2,0 0,2 1,4 2,2 1,6 0,1 Aug.<br />
1,5 0,6 2,4 p) 1,8 0,3 1,1 1,5 0,5 0,3 Sept.<br />
Staatlicher Finanzierungssaldo 11)<br />
− 0,9 − 3,6 − 5,1 − 4,5 − 9,8 − 7,7 − 5,9 − 9,7 − 5,3 2010<br />
− 0,2 − 2,8 − 4,5 − 2,5 − 4,4 − 5,1 − 6,4 − 9,4 − 6,3 2011<br />
− 0,8 − 3,3 − 4,1 − 2,5 − 6,4 − 4,3 − 4,0 − 10,6 − 6,3 2012<br />
Staatliche Verschuldung 11)<br />
19,2 67,4 63,1 72,0 94,0 41,0 38,6 61,5 61,3 2010<br />
18,3 70,3 65,5 72,5 108,3 43,3 46,9 69,3 71,1 2011<br />
20,8 72,1 71,2 73,4 123,6 52,1 54,1 84,2 85,8 2012<br />
Monat im Quartal. 8 In Prozent der zivilen Erwerbspersonen; saisonbereinigt. 9 Stan- (ESVG 1995), Mitgliedstaaten: Europäische Kommission (Maastricht-Definition). Die<br />
dardisierte Arbeitslosenquote Deutschland: Eigene Berechnung auf Basis von Ur- hier für Deutschland bereits ausgewiesenen Ergebnisse der jüngsten Revisionen,<br />
sprungswerten des Statistischen Bundesamtes. 10 Ab 2011 einschl. Estland. 11 In Defizit, Bruttoinlandsprodukt sowie staatliche Verschuldung betreffend, sind in der Be-<br />
Prozent des Bruttoinlandsprodukts; EWU-Aggregat: Europäische Zentralbank rechnung des Aggregats noch nicht berücksichtigt.