

River and stream water quality and ecology - Greater Wellington ...
River and stream water quality and ecology - Greater Wellington ...
River and stream water quality and ecology - Greater Wellington ...

Create successful ePaper yourself
Turn your PDF publications into a flip-book with our unique Google optimized e-Paper software.
<strong>River</strong> <strong>and</strong> <strong>stream</strong> <strong>water</strong> <strong>quality</strong> <strong>and</strong> <strong>ecology</strong> in the <strong>Wellington</strong> region: State <strong>and</strong> trends<br />
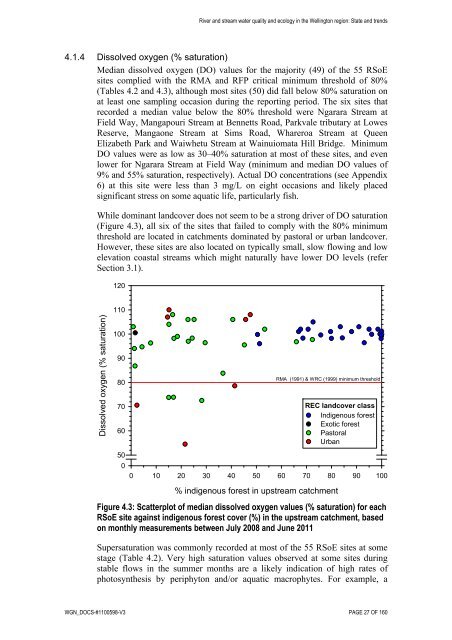
4.1.4 Dissolved oxygen (% saturation)<br />
Median dissolved oxygen (DO) values for the majority (49) of the 55 RSoE<br />
sites complied with the RMA <strong>and</strong> RFP critical minimum threshold of 80%<br />
(Tables 4.2 <strong>and</strong> 4.3), although most sites (50) did fall below 80% saturation on<br />
at least one sampling occasion during the reporting period. The six sites that<br />
recorded a median value below the 80% threshold were Ngarara Stream at<br />
Field Way, Mangapouri Stream at Bennetts Road, Parkvale tributary at Lowes<br />
Reserve, Mangaone Stream at Sims Road, Whareroa Stream at Queen<br />
Elizabeth Park <strong>and</strong> Waiwhetu Stream at Wainuiomata Hill Bridge. Minimum<br />
DO values were as low as 30–40% saturation at most of these sites, <strong>and</strong> even<br />
lower for Ngarara Stream at Field Way (minimum <strong>and</strong> median DO values of<br />
9% <strong>and</strong> 55% saturation, respectively). Actual DO concentrations (see Appendix<br />
6) at this site were less than 3 mg/L on eight occasions <strong>and</strong> likely placed<br />
significant stress on some aquatic life, particularly fish.<br />
While dominant l<strong>and</strong>cover does not seem to be a strong driver of DO saturation<br />
(Figure 4.3), all six of the sites that failed to comply with the 80% minimum<br />
threshold are located in catchments dominated by pastoral or urban l<strong>and</strong>cover.<br />
However, these sites are also located on typically small, slow flowing <strong>and</strong> low<br />
elevation coastal <strong>stream</strong>s which might naturally have lower DO levels (refer<br />
Section 3.1).<br />
Dissolved oxygen (% saturation)<br />
120<br />
110<br />
100<br />
90<br />
80<br />
70<br />
60<br />
50<br />
0<br />
RMA (1991) & WRC (1999) minimum threshold<br />
0 10 20 30 40 50 60 70 80 90 100<br />
% indigenous forest in up<strong>stream</strong> catchment<br />
REC l<strong>and</strong>cover class<br />
Indigenous forest<br />
Exotic forest<br />
Pastoral<br />
Urban<br />
Figure 4.3: Scatterplot of median dissolved oxygen values (% saturation) for each<br />
RSoE site against indigenous forest cover (%) in the up<strong>stream</strong> catchment, based<br />
on monthly measurements between July 2008 <strong>and</strong> June 2011<br />
Supersaturation was commonly recorded at most of the 55 RSoE sites at some<br />
stage (Table 4.2). Very high saturation values observed at some sites during<br />
stable flows in the summer months are a likely indication of high rates of<br />
photosynthesis by periphyton <strong>and</strong>/or aquatic macrophytes. For example, a<br />
WGN_DOCS-#1100598-V3 PAGE 27 OF 160


