

River and stream water quality and ecology - Greater Wellington ...
River and stream water quality and ecology - Greater Wellington ...
River and stream water quality and ecology - Greater Wellington ...

You also want an ePaper? Increase the reach of your titles
YUMPU automatically turns print PDFs into web optimized ePapers that Google loves.
<strong>River</strong> <strong>and</strong> <strong>stream</strong> <strong>water</strong> <strong>quality</strong> <strong>and</strong> <strong>ecology</strong> in the <strong>Wellington</strong> region: State <strong>and</strong> trends<br />
7. Fish – state <strong>and</strong> trends<br />
As outlined in Section 2.4.2, fish monitoring using a st<strong>and</strong>ardised survey<br />
approach has only been trialled at five of the 55 RSoE sites to date. This<br />
section summarises the results of this monitoring <strong>and</strong> compares these against<br />
RSoE <strong>water</strong> <strong>quality</strong>, periphyton <strong>and</strong> macroinvertebrate monitoring results. To<br />
help provide a more complete picture of the fish health in the <strong>Wellington</strong><br />
region’s rivers <strong>and</strong> <strong>stream</strong>s, the second part of this section presents an analysis<br />
of state <strong>and</strong> trends in fresh<strong>water</strong> fish communities using data extracted from the<br />
New Zeal<strong>and</strong> Fresh<strong>water</strong> Fish Database (NZFFD). Administered by NIWA,<br />
this database provides a large amount of information on the distribution of<br />
fresh<strong>water</strong> fish within the <strong>Wellington</strong> region <strong>and</strong> NZFFD data has previously<br />
been used successfully at both regional <strong>and</strong> national scales to analyse spatial<br />
<strong>and</strong> temporal trends in fresh<strong>water</strong> fish populations (Joy 2009; Joy 2011).<br />
7.1 State<br />
7.1.1 Approach to analysis<br />
The Index of Biotic Integrity (IBI) was calculated for each site (using both<br />
RSoE <strong>and</strong> NZFDD fish data) to help facilitate inter-site comparisons <strong>and</strong><br />
provide an indication of overall fish community condition. The IBI is a<br />
combination of six metrics that was developed specifically to assess the<br />
condition of New Zeal<strong>and</strong>’s fish fauna <strong>and</strong> takes into account the fact that<br />
many species exhibit diadromous life histories (ie, often migrate between the<br />
ocean <strong>and</strong> fresh<strong>water</strong> at some point in their lifecycle). The IBI compares the<br />
species found at a site with those expected to be at a site, while taking into<br />
account natural changes that occur with distance inl<strong>and</strong> <strong>and</strong> elevation. For full<br />
details of the IBI see Joy <strong>and</strong> Death (2004) <strong>and</strong> Joy (2004).<br />
IBI scores were generated for each site in a Microsoft Excel spreadsheet macro<br />
using a version of the IBI calibrated for the <strong>Wellington</strong> region (Joy 2004). IBI<br />
scores can range from 0 (no fish present) to 60, with a score of 60 indicating that<br />
all fish expected to be present were found. Interpretation of IBI scores was<br />
undertaken using the classes recommended in Joy (2004) <strong>and</strong> outlined in Table<br />
7.1. See Section 4.1.1 for interpretation of the box plots presented in this section.<br />
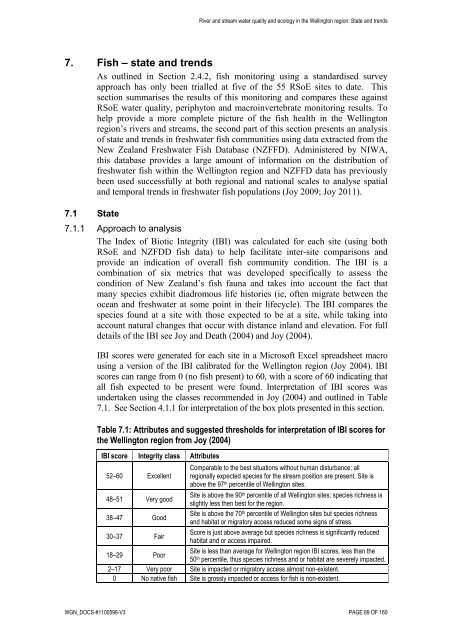
Table 7.1: Attributes <strong>and</strong> suggested thresholds for interpretation of IBI scores for<br />
the <strong>Wellington</strong> region from Joy (2004)<br />
IBI score Integrity class Attributes<br />
52–60 Excellent<br />
48–51 Very good<br />
38–47 Good<br />
Comparable to the best situations without human disturbance; all<br />
regionally expected species for the <strong>stream</strong> position are present. Site is<br />
above the 97 th percentile of <strong>Wellington</strong> sites.<br />
Site is above the 90th percentile of all <strong>Wellington</strong> sites; species richness is<br />
slightly less then best for the region.<br />
Site is above the 70th percentile of <strong>Wellington</strong> sites but species richness<br />
<strong>and</strong> habitat or migratory access reduced some signs of stress.<br />
30–37 Fair<br />
Score is just above average but species richness is significantly reduced<br />
habitat <strong>and</strong> or access impaired.<br />
18–29 Poor<br />
Site is less than average for <strong>Wellington</strong> region IBI scores, less than the<br />
50th percentile, thus species richness <strong>and</strong> or habitat are severely impacted.<br />
2–17 Very poor Site is impacted or migratory access almost non-existent.<br />
0 No native fish Site is grossly impacted or access for fish is non-existent.<br />
WGN_DOCS-#1100598-V3 PAGE 89 OF 160


