

River and stream water quality and ecology - Greater Wellington ...
River and stream water quality and ecology - Greater Wellington ...
River and stream water quality and ecology - Greater Wellington ...

You also want an ePaper? Increase the reach of your titles
YUMPU automatically turns print PDFs into web optimized ePapers that Google loves.
TN (mg/L)<br />
Temperature ( 0 c)<br />
Shade score<br />
Mean annual maximum accrual (days)<br />
17<br />
16<br />
15<br />
14<br />
13<br />
12<br />
11<br />
10<br />
9<br />
0.1 1 10 100 1000<br />
10<br />
1<br />
0.1<br />
Chlorophyll a (mg/m 2 )<br />
0.01<br />
0.1 1 10 100 1000<br />
25<br />
20<br />
15<br />
10<br />
5<br />
0<br />
200<br />
180<br />
160<br />
140<br />
120<br />
100<br />
80<br />
60<br />
40<br />
Chlorophyll a (mg/m 2 )<br />
0.1 1 10 100 1000<br />
Chlorophyll a (mg/m 2 )<br />
20<br />
0.1 1 10 100 1000<br />
Chlorophyll a (mg/m 2 )<br />
<strong>River</strong> <strong>and</strong> <strong>stream</strong> <strong>water</strong> <strong>quality</strong> <strong>and</strong> <strong>ecology</strong> in the <strong>Wellington</strong> region: State <strong>and</strong> trends<br />
0.0<br />
0.1 1 10 100 1000<br />
Chlorophyll a (mg/m 2 )<br />
WGN_DOCS-#1100598-V3 PAGE 63 OF 160<br />
TP (mg/L)<br />
Water clarity (m)<br />
Habitat score<br />
Substrate index<br />
4.0<br />
3.5<br />
3.0<br />
2.5<br />
2.0<br />
1.5<br />
1.0<br />
0.5<br />
0.1<br />
0.01<br />
0.001<br />
0.1 1 10 100 1000<br />
160<br />
140<br />
120<br />
100<br />
80<br />
60<br />
Chlorophyll a (mg/m 2 )<br />
40<br />
0.1 1 10 100 1000<br />
6.2<br />
6.0<br />
5.8<br />
5.6<br />
5.4<br />
5.2<br />
5.0<br />
4.8<br />
4.6<br />
4.4<br />
4.2<br />
Chlorophyll a (mg/m 2 )<br />
4.0<br />
0.1 1 10 100 1000<br />
Chlorophyll a (mg/m 2 )<br />
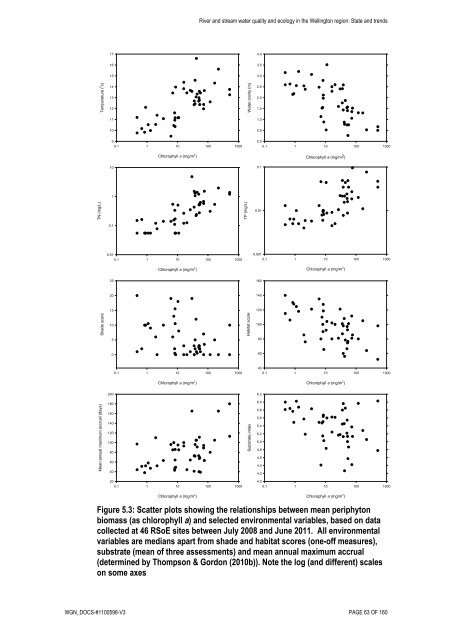
Figure 5.3: Scatter plots showing the relationships between mean periphyton<br />
biomass (as chlorophyll a) <strong>and</strong> selected environmental variables, based on data<br />
collected at 46 RSoE sites between July 2008 <strong>and</strong> June 2011. All environmental<br />
variables are medians apart from shade <strong>and</strong> habitat scores (one-off measures),<br />
substrate (mean of three assessments) <strong>and</strong> mean annual maximum accrual<br />
(determined by Thompson & Gordon (2010b)). Note the log (<strong>and</strong> different) scales<br />
on some axes


