

River and stream water quality and ecology - Greater Wellington ...
River and stream water quality and ecology - Greater Wellington ...
River and stream water quality and ecology - Greater Wellington ...

You also want an ePaper? Increase the reach of your titles
YUMPU automatically turns print PDFs into web optimized ePapers that Google loves.
RS06<br />
Shade<br />
RS11<br />
Habitat<br />
RS35<br />
RS49 RS43<br />
RS44<br />
RS54<br />
RS09<br />
Black disc<br />
RS28<br />
Substrate<br />
Cond. TOC<br />
RS03 RS20 RS52<br />
RS56 RS26<br />
RS17<br />
RS25<br />
RS23<br />
RS10 RS24<br />
RS13<br />
RS14<br />
RS29 RS40<br />
RS50<br />
Amm N<br />
RS38<br />
DRP<br />
TP<br />
TN<br />
TKN<br />
RS05<br />
RS31 RS47<br />
RS55<br />
RS48<br />
RS21<br />
RS32 RS41<br />
RS22<br />
DIN<br />
RS37<br />
RS51<br />
Turb.<br />
RS16<br />
Temp.<br />
RS15<br />
RS18<br />
RS46<br />
RS33<br />
RS34<br />
RS30<br />
<strong>River</strong> <strong>and</strong> <strong>stream</strong> <strong>water</strong> <strong>quality</strong> <strong>and</strong> <strong>ecology</strong> in the <strong>Wellington</strong> region: State <strong>and</strong> trends<br />
RS19<br />
RS07<br />
RS02<br />
RS12<br />
L<strong>and</strong>cover<br />
U<br />
IF<br />
P<br />
EF<br />
WGN_DOCS-#1100598-V3 PAGE 81 OF 160<br />
RS36<br />
RS53<br />
RS45<br />
RS04<br />
RS42<br />
2D Stress: 0.11<br />
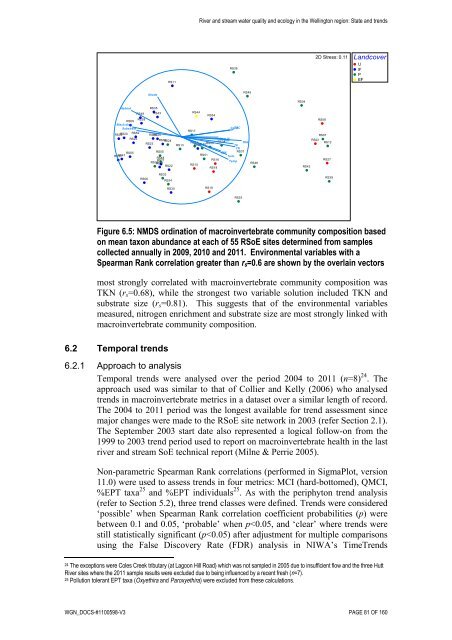
Figure 6.5: NMDS ordination of macroinvertebrate community composition based<br />
on mean taxon abundance at each of 55 RSoE sites determined from samples<br />
collected annually in 2009, 2010 <strong>and</strong> 2011. Environmental variables with a<br />
Spearman Rank correlation greater than rs=0.6 are shown by the overlain vectors<br />
most strongly correlated with macroinvertebrate community composition was<br />
TKN (rs=0.68), while the strongest two variable solution included TKN <strong>and</strong><br />
substrate size (rs=0.81). This suggests that of the environmental variables<br />
measured, nitrogen enrichment <strong>and</strong> substrate size are most strongly linked with<br />
macroinvertebrate community composition.<br />
6.2 Temporal trends<br />
6.2.1 Approach to analysis<br />
Temporal trends were analysed over the period 2004 to 2011 (n=8) 24 . The<br />
approach used was similar to that of Collier <strong>and</strong> Kelly (2006) who analysed<br />
trends in macroinvertebrate metrics in a dataset over a similar length of record.<br />
The 2004 to 2011 period was the longest available for trend assessment since<br />
major changes were made to the RSoE site network in 2003 (refer Section 2.1).<br />
The September 2003 start date also represented a logical follow-on from the<br />
1999 to 2003 trend period used to report on macroinvertebrate health in the last<br />
river <strong>and</strong> <strong>stream</strong> SoE technical report (Milne & Perrie 2005).<br />
Non-parametric Spearman Rank correlations (performed in SigmaPlot, version<br />
11.0) were used to assess trends in four metrics: MCI (hard-bottomed), QMCI,<br />
%EPT taxa 25 <strong>and</strong> %EPT individuals 25 . As with the periphyton trend analysis<br />
(refer to Section 5.2), three trend classes were defined. Trends were considered<br />
‘possible’ when Spearman Rank correlation coefficient probabilities (p) were<br />
between 0.1 <strong>and</strong> 0.05, ‘probable’ when p


