River and stream water quality and ecology - Greater Wellington ...
River and stream water quality and ecology - Greater Wellington ...
River and stream water quality and ecology - Greater Wellington ...
You also want an ePaper? Increase the reach of your titles
YUMPU automatically turns print PDFs into web optimized ePapers that Google loves.
<strong>River</strong> <strong>and</strong> <strong>stream</strong> <strong>water</strong> <strong>quality</strong> <strong>and</strong> <strong>ecology</strong> in the <strong>Wellington</strong> region: State <strong>and</strong> trends<br />
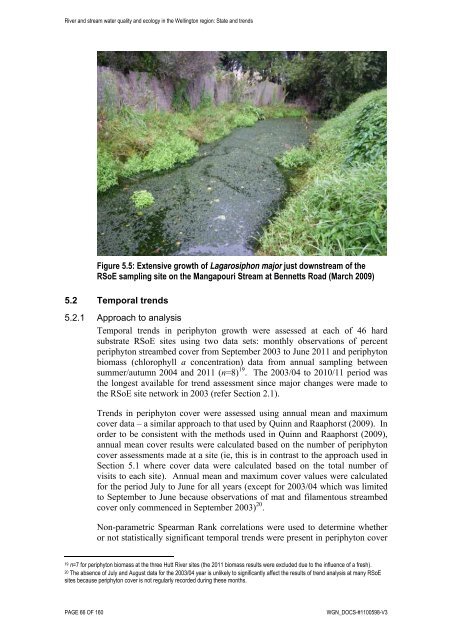
Figure 5.5: Extensive growth of Lagarosiphon major just down<strong>stream</strong> of the<br />
RSoE sampling site on the Mangapouri Stream at Bennetts Road (March 2009)<br />
5.2 Temporal trends<br />
5.2.1 Approach to analysis<br />
Temporal trends in periphyton growth were assessed at each of 46 hard<br />
substrate RSoE sites using two data sets: monthly observations of percent<br />
periphyton <strong>stream</strong>bed cover from September 2003 to June 2011 <strong>and</strong> periphyton<br />
biomass (chlorophyll a concentration) data from annual sampling between<br />
summer/autumn 2004 <strong>and</strong> 2011 (n=8) 19 . The 2003/04 to 2010/11 period was<br />
the longest available for trend assessment since major changes were made to<br />
the RSoE site network in 2003 (refer Section 2.1).<br />
Trends in periphyton cover were assessed using annual mean <strong>and</strong> maximum<br />
cover data – a similar approach to that used by Quinn <strong>and</strong> Raaphorst (2009). In<br />
order to be consistent with the methods used in Quinn <strong>and</strong> Raaphorst (2009),<br />
annual mean cover results were calculated based on the number of periphyton<br />
cover assessments made at a site (ie, this is in contrast to the approach used in<br />
Section 5.1 where cover data were calculated based on the total number of<br />
visits to each site). Annual mean <strong>and</strong> maximum cover values were calculated<br />
for the period July to June for all years (except for 2003/04 which was limited<br />
to September to June because observations of mat <strong>and</strong> filamentous <strong>stream</strong>bed<br />
cover only commenced in September 2003) 20 .<br />
Non-parametric Spearman Rank correlations were used to determine whether<br />
or not statistically significant temporal trends were present in periphyton cover<br />
19 n=7 for periphyton biomass at the three Hutt <strong>River</strong> sites (the 2011 biomass results were excluded due to the influence of a fresh).<br />
20 The absence of July <strong>and</strong> August data for the 2003/04 year is unlikely to significantly affect the results of trend analysis at many RSoE<br />
sites because periphyton cover is not regularly recorded during these months.<br />
PAGE 66 OF 160 WGN_DOCS-#1100598-V3


