

River and stream water quality and ecology - Greater Wellington ...
River and stream water quality and ecology - Greater Wellington ...
River and stream water quality and ecology - Greater Wellington ...

Create successful ePaper yourself
Turn your PDF publications into a flip-book with our unique Google optimized e-Paper software.
<strong>River</strong> <strong>and</strong> <strong>stream</strong> <strong>water</strong> <strong>quality</strong> <strong>and</strong> <strong>ecology</strong> in the <strong>Wellington</strong> region: State <strong>and</strong> trends<br />
lowl<strong>and</strong> TVs. For example, while the decreasing NNN trends of highest<br />
magnitude were observed at Taueru <strong>River</strong> at Gladstone <strong>and</strong> Whangaehu <strong>River</strong><br />
250 m from confluence (0.120 <strong>and</strong> 0.214 mg/L/year, respectively), the state<br />
analysis shows that median NNN concentrations are still well above the<br />
ANZECC (2000) lowl<strong>and</strong> TV of 0.444 mg/L.<br />
The reasons for the observed trends are not clear. In the case of NNN <strong>and</strong> TN<br />
concentrations, decreasing trends were present at sites located in catchments<br />
dominated by all of the major l<strong>and</strong>cover types found in the region (eg, indigenous<br />
forest, exotic forest, pastoral <strong>and</strong> urban), including a number of reference sites<br />
(eg, Otaki <strong>River</strong> at Pukehinau) <strong>and</strong> also several sites that typically record very<br />
low median NNN <strong>and</strong> TN values (eg, Akatarawa <strong>River</strong> at Hutt confluence <strong>and</strong><br />
Taueru <strong>River</strong> at Castlehill). This suggests that the declining trends may be<br />
related to natural factors such as climate.<br />
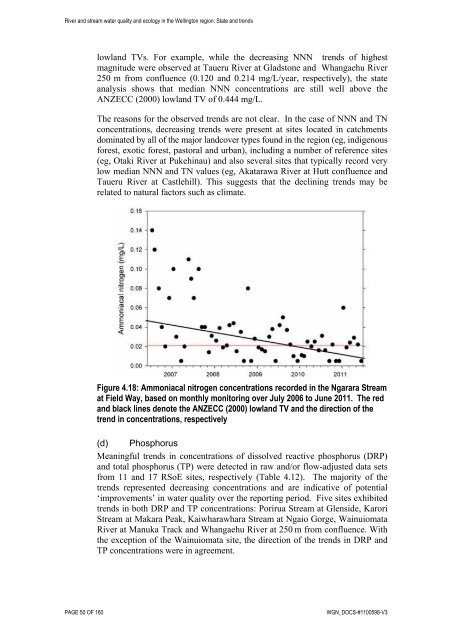
Figure 4.18: Ammoniacal nitrogen concentrations recorded in the Ngarara Stream<br />
at Field Way, based on monthly monitoring over July 2006 to June 2011. The red<br />
<strong>and</strong> black lines denote the ANZECC (2000) lowl<strong>and</strong> TV <strong>and</strong> the direction of the<br />
trend in concentrations, respectively<br />
(d) Phosphorus<br />
Meaningful trends in concentrations of dissolved reactive phosphorus (DRP)<br />
<strong>and</strong> total phosphorus (TP) were detected in raw <strong>and</strong>/or flow-adjusted data sets<br />
from 11 <strong>and</strong> 17 RSoE sites, respectively (Table 4.12). The majority of the<br />
trends represented decreasing concentrations <strong>and</strong> are indicative of potential<br />
‘improvements’ in <strong>water</strong> <strong>quality</strong> over the reporting period. Five sites exhibited<br />
trends in both DRP <strong>and</strong> TP concentrations: Porirua Stream at Glenside, Karori<br />
Stream at Makara Peak, Kaiwharawhara Stream at Ngaio Gorge, Wainuiomata<br />
<strong>River</strong> at Manuka Track <strong>and</strong> Whangaehu <strong>River</strong> at 250 m from confluence. With<br />
the exception of the Wainuiomata site, the direction of the trends in DRP <strong>and</strong><br />
TP concentrations were in agreement.<br />
PAGE 50 OF 160 WGN_DOCS-#1100598-V3


