Onsite Use of Recycled Asphalt Pavement Materials and Geocells to ...
Onsite Use of Recycled Asphalt Pavement Materials and Geocells to ...
Onsite Use of Recycled Asphalt Pavement Materials and Geocells to ...

You also want an ePaper? Increase the reach of your titles
YUMPU automatically turns print PDFs into web optimized ePapers that Google loves.
Depth (cm.)<br />
10<br />
14<br />
18<br />
22<br />
26<br />
Before test<br />
AfterTest<br />
30<br />
-100 -80 -60 -40 -20 0 20 40 60 80 100<br />
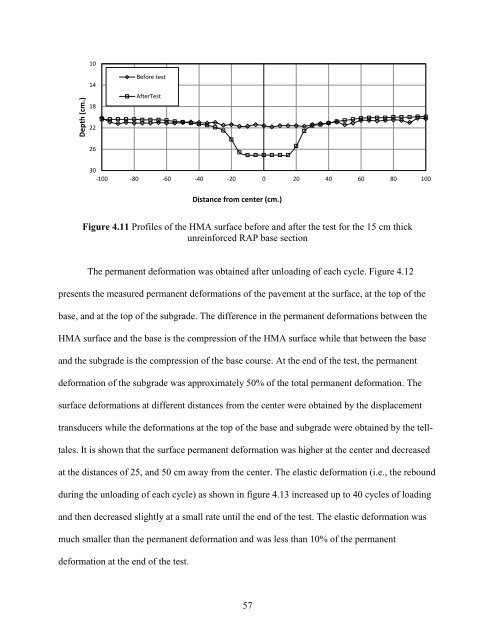
Figure 4.11 Pr<strong>of</strong>iles <strong>of</strong> the HMA surface before <strong>and</strong> after the test for the 15 cm thick<br />
unreinforced RAP base section<br />
The permanent deformation was obtained after unloading <strong>of</strong> each cycle. Figure 4.12<br />
presents the measured permanent deformations <strong>of</strong> the pavement at the surface, at the <strong>to</strong>p <strong>of</strong> the<br />
base, <strong>and</strong> at the <strong>to</strong>p <strong>of</strong> the subgrade. The difference in the permanent deformations between the<br />
HMA surface <strong>and</strong> the base is the compression <strong>of</strong> the HMA surface while that between the base<br />
<strong>and</strong> the subgrade is the compression <strong>of</strong> the base course. At the end <strong>of</strong> the test, the permanent<br />
deformation <strong>of</strong> the subgrade was approximately 50% <strong>of</strong> the <strong>to</strong>tal permanent deformation. The<br />
surface deformations at different distances from the center were obtained by the displacement<br />
transducers while the deformations at the <strong>to</strong>p <strong>of</strong> the base <strong>and</strong> subgrade were obtained by the tell-<br />
tales. It is shown that the surface permanent deformation was higher at the center <strong>and</strong> decreased<br />
at the distances <strong>of</strong> 25, <strong>and</strong> 50 cm away from the center. The elastic deformation (i.e., the rebound<br />
during the unloading <strong>of</strong> each cycle) as shown in figure 4.13 increased up <strong>to</strong> 40 cycles <strong>of</strong> loading<br />
<strong>and</strong> then decreased slightly at a small rate until the end <strong>of</strong> the test. The elastic deformation was<br />
much smaller than the permanent deformation <strong>and</strong> was less than 10% <strong>of</strong> the permanent<br />
deformation at the end <strong>of</strong> the test.<br />
Distance from center (cm.)<br />
57