Onsite Use of Recycled Asphalt Pavement Materials and Geocells to ...
Onsite Use of Recycled Asphalt Pavement Materials and Geocells to ...
Onsite Use of Recycled Asphalt Pavement Materials and Geocells to ...

Create successful ePaper yourself
Turn your PDF publications into a flip-book with our unique Google optimized e-Paper software.
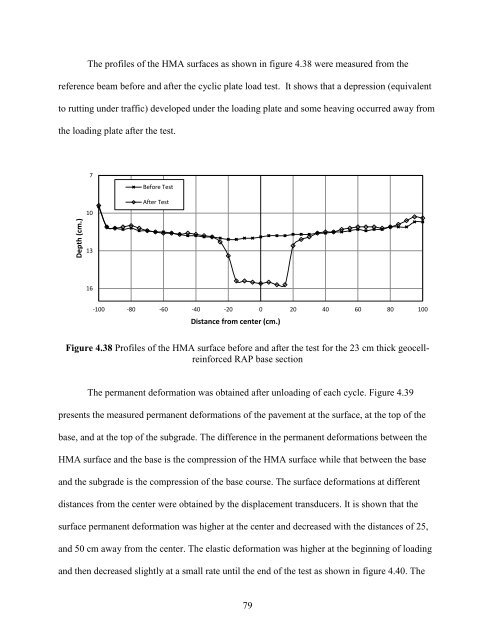
The pr<strong>of</strong>iles <strong>of</strong> the HMA surfaces as shown in figure 4.38 were measured from the<br />
reference beam before <strong>and</strong> after the cyclic plate load test. It shows that a depression (equivalent<br />
<strong>to</strong> rutting under traffic) developed under the loading plate <strong>and</strong> some heaving occurred away from<br />
the loading plate after the test.<br />
Depth (cm.)<br />
7<br />
10<br />
13<br />
16<br />
Before Test<br />
After Test<br />
-100 -80 -60 -40 -20 0 20 40 60 80 100<br />
Distance from center (cm.)<br />
Figure 4.38 Pr<strong>of</strong>iles <strong>of</strong> the HMA surface before <strong>and</strong> after the test for the 23 cm thick geocellreinforced<br />
RAP base section<br />
The permanent deformation was obtained after unloading <strong>of</strong> each cycle. Figure 4.39<br />
presents the measured permanent deformations <strong>of</strong> the pavement at the surface, at the <strong>to</strong>p <strong>of</strong> the<br />
base, <strong>and</strong> at the <strong>to</strong>p <strong>of</strong> the subgrade. The difference in the permanent deformations between the<br />
HMA surface <strong>and</strong> the base is the compression <strong>of</strong> the HMA surface while that between the base<br />
<strong>and</strong> the subgrade is the compression <strong>of</strong> the base course. The surface deformations at different<br />
distances from the center were obtained by the displacement transducers. It is shown that the<br />
surface permanent deformation was higher at the center <strong>and</strong> decreased with the distances <strong>of</strong> 25,<br />
<strong>and</strong> 50 cm away from the center. The elastic deformation was higher at the beginning <strong>of</strong> loading<br />
<strong>and</strong> then decreased slightly at a small rate until the end <strong>of</strong> the test as shown in figure 4.40. The<br />
79